
Learning Objectives
- Understand the natural history of disease, including its stages and varying progressions.
- Differentiate between key epidemiological periods such as incubation, latency, and infectious latent period.
- Recognize the 'iceberg phenomenon' of disease and its implications.
- Identify the levels of prevention (primordial, primary, secondary, tertiary) and their application.
- Grasp the concepts of screening, lead-time bias, and overdiagnosis.
- Explain the Epidemiological Triad, Chain of Infection, Web of Causation, and Wheel of Causation models.
- Define necessary, sufficient, and component causes using the sufficient component cause model.
- Outline the basic principles and limitations of the SIR and SEIR epidemiological models.
- Apply these concepts to a fictional nursing community case study.
The natural history of disease describes the progression of a disease in an individual over time, in the absence of treatment. It is crucial to understand that this concept is purely descriptive and does not recommend withholding care; rather, it provides a framework for understanding disease progression and identifying opportunities for intervention. There is no inevitable progression; stages can vary.
Stages of Disease Progression
The natural history of disease can be broadly divided into several stages:
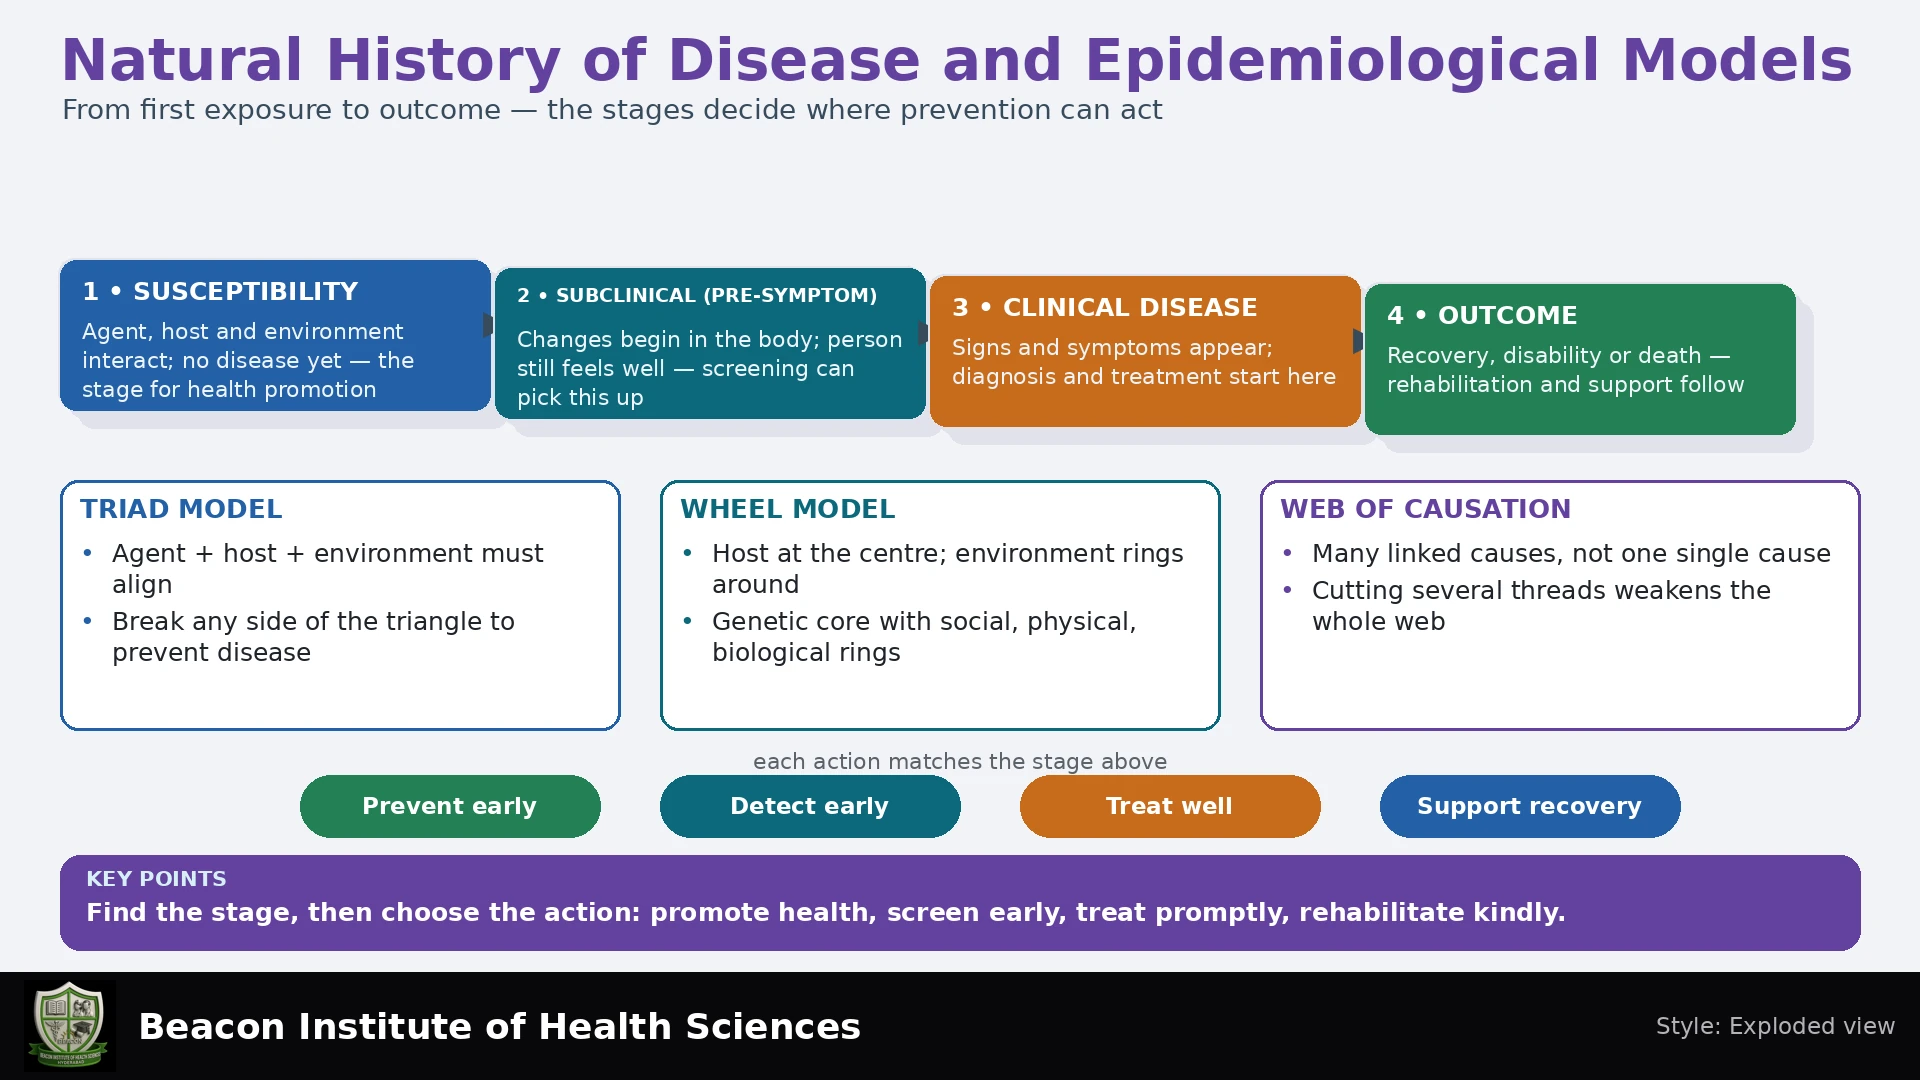
1. Pre-pathogenesis (Susceptibility Stage)
In this initial stage, an individual is susceptible to the disease but has not yet been exposed to the causative agent or developed any pathological changes. Factors related to the host, agent, and environment interact to create a state of risk.
2. Pathogenesis
Pathogenesis begins when the disease process starts. Exposure alone does not always cause infection or disease. Pathogenesis includes subclinical changes and clinically apparent disease.
- Biological Onset: The point at which the disease process begins at a cellular or molecular level, often before any signs or symptoms are evident.
- Subclinical Stage: During this period, the disease is present and progressing, but the individual does not experience or display any noticeable symptoms. It is the early, symptom-free part of pathogenesis.
- Clinical Horizon: This marks the onset of clinically apparent signs or symptoms. A suitable screening test may detect disease earlier, during a detectable preclinical phase.
- Symptom Onset: The point at which the individual begins to experience and manifest symptoms. It is important to note that symptom onset does not necessarily equate to diagnosis.
3. Clinical Disease
Once symptoms appear, the disease is considered clinically evident. This stage is characterized by the presence of recognizable signs and symptoms, leading to diagnosis and potential treatment. The disease can then progress to various outcomes:
- Recovery: The individual returns to a state of health.
- Chronicity: The disease persists over a long period, potentially for the individual's lifetime.
- Disability: The disease leads to a permanent or temporary impairment of function.
- Death: The ultimate adverse outcome of the disease.
Key Epidemiological Distinctions and Phenomena
Incubation Period vs. Infectious Latent Period
- Incubation Period: For infectious diseases, this is the time interval between actual infection (entry of the pathogen into the host) and the first appearance of symptoms.
- Infectious Latent Period: This is the period from infection until the individual becomes infectious (able to transmit the pathogen to others). Importantly, the infectious latent period can be distinct from the incubation period. For chronic diseases, 'latency' often refers to the period between exposure and disease onset, where the disease is biologically present but not clinically manifest.
Timeline Example
Consider a hypothetical scenario for a novel pathogen:
- Day 0: Infection occurs.
- Day 2: Individual becomes infectious (Infectious Latent Period = 2 days).
- Day 5: First symptoms appear (Incubation Period = 5 days).
In this example, the individual is infectious for three days (Day 2 to Day 5) before showing any symptoms.
Asymptomatic Infection and Carriers
- Asymptomatic Infection: An individual is infected with a pathogen but never develops symptoms of the disease. They may still be able to transmit the pathogen.
- Carriers: Individuals who harbor an infectious agent without showing symptoms, but who are capable of transmitting the infection to others. It is important to remember that not all carriers are permanently infectious; the duration of carriage can vary.
The Iceberg Phenomenon of Disease
This concept illustrates that only a fraction of existing cases of a disease may be clinically apparent or recognized. The visible tip of the iceberg represents diagnosed cases, while the much larger, submerged portion represents undiagnosed cases, subclinical infections, or individuals who are infected but asymptomatic. There are no universal proportions for the visible versus hidden parts of the iceberg; it varies significantly by disease.
Levels of Prevention
Prevention strategies are applied at different stages of the natural history of disease:
1. Primordial Prevention
This level focuses on preventing the emergence of risk factors themselves in populations. Examples include national policies for healthy eating or active lifestyles to prevent the development of widespread obesity, which is a risk factor for many chronic diseases.
2. Primary Prevention
Aims to prevent the onset of disease by reducing exposure to risk factors or by increasing resistance. This occurs during the pre-pathogenesis stage.
- Example: Vaccinations, health education campaigns, promoting safe water practices, use of personal protective equipment.
3. Secondary Prevention
Focuses on early detection and prompt treatment of disease to halt its progression or minimize its impact. This occurs during the subclinical or early clinical stages.
- Example: Screening programs (e.g., mammography for breast cancer, blood pressure checks for hypertension), early intervention for developmental delays.
4. Tertiary Prevention
Aims to reduce the impact of an existing disease or disability, prevent complications, and improve quality of life. This occurs during the clinical disease stage, especially for chronic conditions.
- Example: Rehabilitation after a stroke, managing diabetes complications, pain management for chronic illness.
Screening
Screening is a secondary prevention strategy involving the presumptive identification of unrecognized disease or defects by means of tests, examinations, or other procedures. It is crucial to understand that screening is not a diagnosis; positive screening results require further diagnostic confirmation.
- Lead-time bias: This occurs when a disease is detected earlier through screening, making the survival time measured from diagnosis appear longer, even if the actual time of death remains unchanged. This does not mean the intervention delayed death, only that diagnosis occurred earlier.
- Overdiagnosis: This refers to the diagnosis of a disease that would never have caused symptoms or harm during a person's lifetime. It can lead to unnecessary treatment and associated risks or anxieties.
- Follow-up: Adequate follow-up is essential for individuals with positive screening results to ensure timely diagnosis and appropriate management.
Epidemiological Models of Causation
Epidemiological models help us understand the complex interplay of factors contributing to disease. It is important to note that these models are conceptual tools; they do not imply that diagrams prove causal links.
1. The Epidemiological Triad
This classic model describes disease as the outcome of the interaction between three components:
- Agent: The causative factor (e.g., bacteria, virus, toxin, nutritional deficiency, physical trauma).
- Host: The organism that harbors the disease (e.g., human, animal). Host factors include genetic susceptibility, immunity, age, sex, and lifestyle.
- Environment: External factors that influence exposure and susceptibility (e.g., climate, socioeconomic conditions, sanitation, availability of healthcare).
Strengths: Simple, useful for infectious diseases. Limitations: Oversimplifies complex chronic diseases; may not fully account for multiple interacting causes.
2. The Chain of Infection
This model illustrates the sequence of events that allows an infectious agent to spread from one host to another. Breaking any link in the chain can prevent transmission.
- Infectious Agent: The pathogen (e.g., bacterium, virus).
- Reservoir: Where the agent lives and multiplies (e.g., human, animal, environment).
- Portal of Exit: How the agent leaves the reservoir (e.g., respiratory droplets, blood, feces).
- Mode of Transmission: How the agent travels from the portal of exit to a susceptible host (e.g., direct contact, airborne, vector-borne, vehicle-borne).
- Portal of Entry: How the agent enters a new host (e.g., mucous membranes, broken skin, respiratory tract).
- Susceptible Host: An individual lacking effective resistance to the agent.
Intervention Examples: Hand hygiene (break mode of transmission), appropriate isolation precautions (reduce opportunities for transmission), vaccination (increase host resistance), sanitation (break reservoir/mode of transmission).
3. The Web of Causation
This model emphasizes that disease causation is multifactorial, involving a complex network of interconnected biological, behavioral, social, and environmental factors. It recognizes that there is no single cause, but rather an intricate web where altering one factor may have ripple effects. This model helps avoid a 'blame' approach and highlights that association is not sufficient for causation.
4. The Wheel of Causation
This model is an adaptation of the web, placing a genetic core at the center, representing the irreducible human host. Surrounding this core are the biological, physical, and social environments, which interact to influence disease. It is primarily a heuristic (conceptual tool) and not quantitative.
5. Sufficient Component Cause Model (Causal Pies)
This model, proposed by Kenneth Rothman, provides a precise way to think about causation:
- Component Cause: A factor that contributes to a particular disease but is not sufficient on its own to cause the disease.
- Sufficient cause: A complete combination of conditions that produces the specified disease outcome in this conceptual model. Different combinations may lead to the same outcome.
- Necessary cause: A factor that must be present in every causal pathway for that specified disease. A necessary cause may still be insufficient on its own.
For example, infection with the measles virus is necessary for measles, but exposure alone does not ensure illness. Smoking contributes to several lung-cancer pathways, but it is neither necessary nor sufficient by itself. Removing one component can prevent cases through pathways containing that component without eliminating every case.
SIR and SEIR Models
Compartment models group people by infection status and describe movement between groups over time. They help explore possible epidemic patterns under stated assumptions; they do not predict an individual patient's outcome.
| Model | Compartments | Interpretation |
|---|---|---|
| SIR | Susceptible, infectious, removed | Susceptible people become infectious, then leave the infectious group through recovery or another removal process specified by the model. |
| SEIR | Susceptible, exposed, infectious, removed | The exposed group is infected but not yet infectious. This represents the infectious latent period. |
In a simple closed SIR model, with population N, transmission parameter beta and removal rate gamma, the rate of new infection is beta × S × I / N. The equations are dS/dt = −betaSI/N, dI/dt = betaSI/N − gammaI, and dR/dt = gammaI. In SEIR, an additional transition moves infected people from E to I at rate sigmaE. The E compartment does not mean everyone merely exposed to a possible source; its members are already infected.
These basic models often assume homogeneous mixing, constant parameters and a fixed population. Real communities differ by age, contact networks, immunity, travel and access to care. Parameters depend on the disease and setting; estimates have uncertainty. In the simple SIR formulation, R0 = beta/gamma in a fully susceptible population. The effective reproduction number changes with susceptibility and interventions. Values above one indicate potential growth under the model's assumptions, not certainty that every introduction causes a large outbreak.
Nursing Applications
- Ask about exposure dates, symptom onset, vaccination and contact history separately. Record uncertainty rather than inventing dates.
- Apply Standard Precautions to all patients and add disease-appropriate precautions when indicated. Absence of symptoms does not always exclude infectiousness.
- Explain that a screening result estimates risk or identifies possible disease; arrange diagnostic assessment and document follow-up.
- Choose interventions at several levels: safe environments, immunization, early recognition, treatment and rehabilitation.
- Use population models for planning with the public-health team. Clinical decisions still require individual assessment and current guidance.
Fictional Worked Community Example
In a fictional community, a nurse reviews 20 confirmed infections. Twelve people have symptoms and eight remain asymptomatic at the review date. The observed symptomatic proportion is 12/20 × 100 = 60%. This is a description of these cases at this time; some asymptomatic people may later develop symptoms, and the figures do not establish the true community infection count.
One resident was infected on day 0, became infectious on day 2 and developed symptoms on day 5. The infectious latent period is two days; the incubation period is five days. Therefore, symptom-only checks could miss three days of infectiousness. The nurse reports through the approved pathway, supports testing and appropriate precautions, checks household access to care and teaches prevention without blaming the resident.
The triad highlights the pathogen, susceptible people and conditions supporting exposure. The chain of infection helps identify where protective action can interrupt spread. The web of causation adds crowding, insecure work and transport barriers. None of these models alone proves which contact infected a particular person.
Practice Questions with Explained Answers
- Can a screening test become positive before the clinical horizon?
Yes, if a detectable preclinical phase exists and the test can identify it. The clinical horizon refers to clinically apparent disease, not the first possible positive test.
- Does a five-day incubation period mean five days without infectiousness?
No. Incubation measures time to symptoms. Time to infectiousness is a separate interval and may be shorter or longer.
- Is a risk factor automatically a necessary cause?
No. A factor may increase risk without appearing in every pathway. A necessary cause is required for every occurrence of the specifically defined disease.
- What does E mean in SEIR?
It represents infected people who are not yet infectious. This differs from simply having a history of possible exposure.
- Why can longer survival after screen detection be misleading?
Earlier diagnosis can lengthen measured survival without changing the date of death. This is lead-time bias; screening benefit requires suitable outcome evidence.
Conclusion
The natural history of disease connects susceptibility, hidden biological changes, clinical illness and outcomes. Causation models explain different parts of this process, while transmission models explore population patterns under assumptions. Nurses use these ideas to recognize risk, prevent transmission, arrange early assessment and support recovery with accurate communication and careful follow-up.