
Learning Objectives
- Distinguish a count, ratio, proportion and rate.
- Choose suitable numerators, denominators and time periods.
- Calculate disease frequency, mortality and association measures.
- Interpret results with uncertainty, bias and nursing context in mind.
Why Measurement Matters
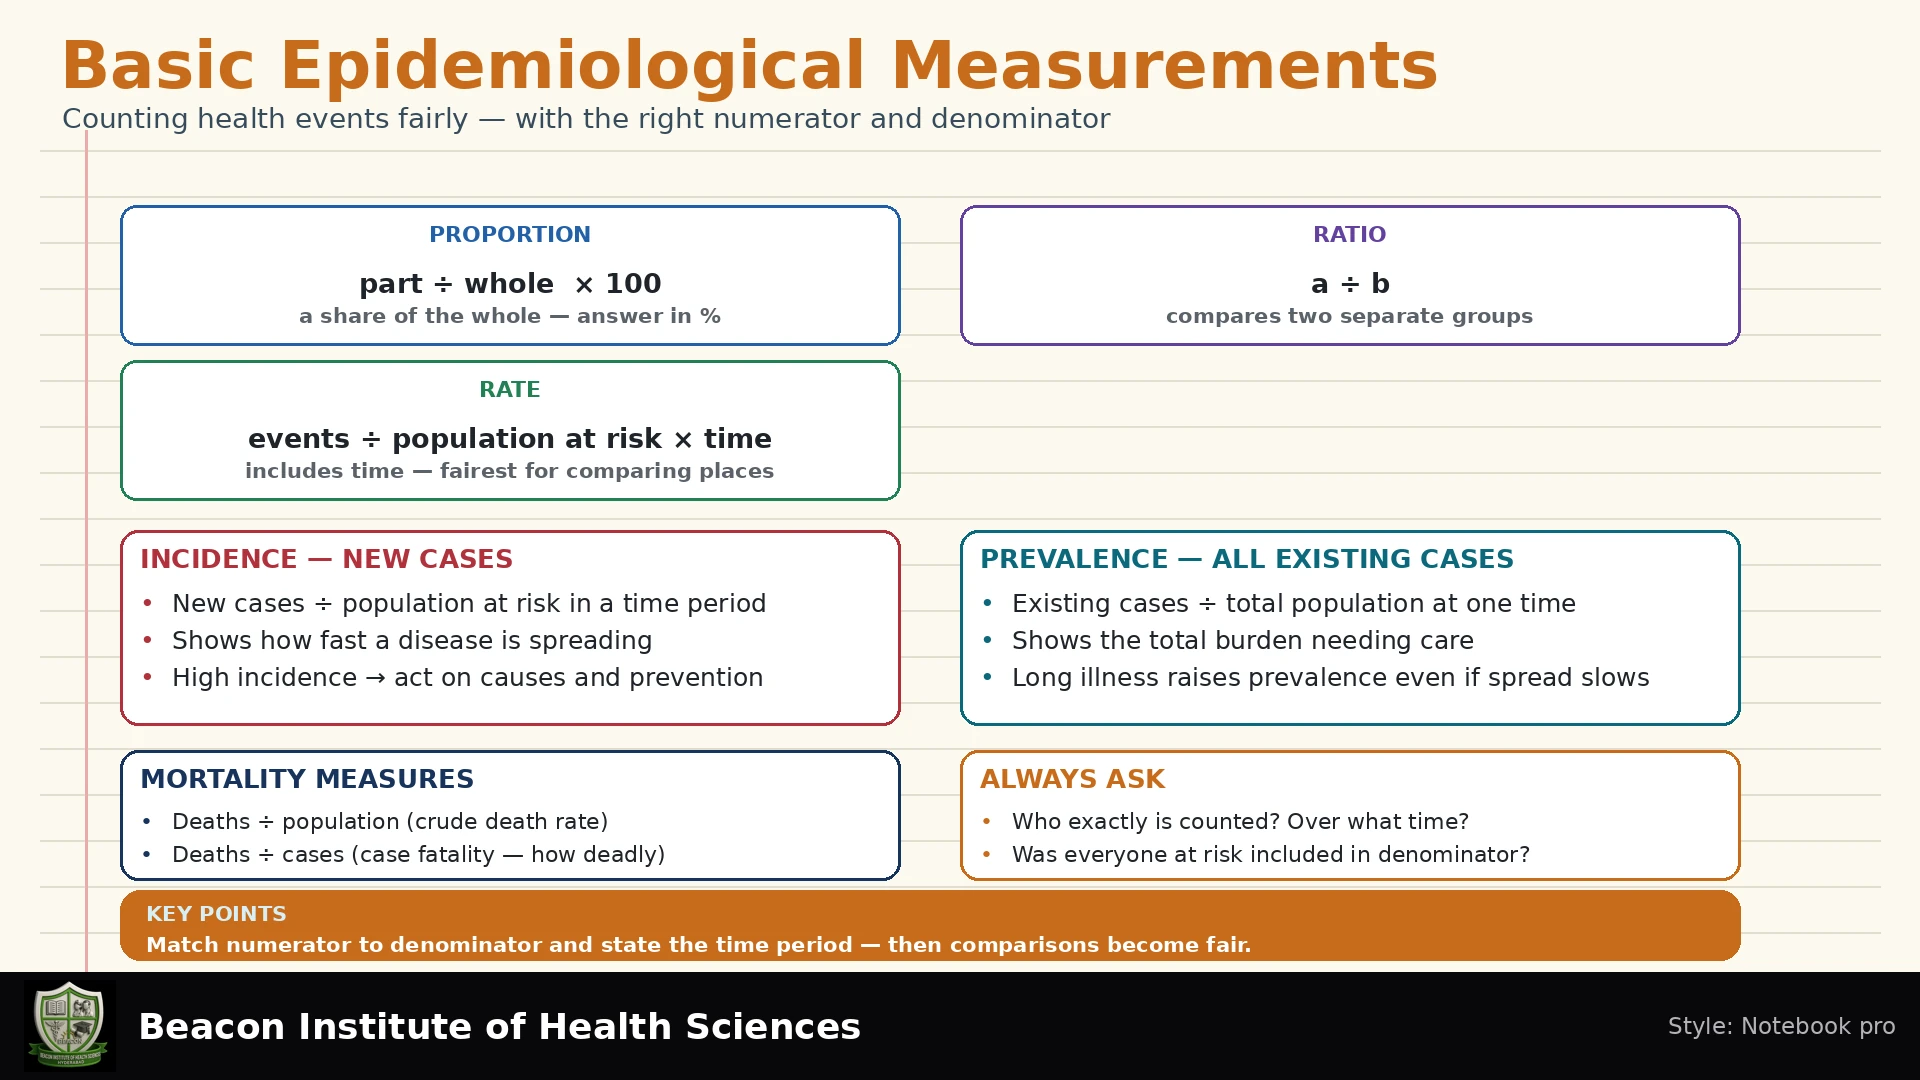
Nurses use epidemiological measurements to describe health problems, compare groups and plan services. A count tells us how many events occurred. A denominator tells us the population or observation time that produced them. Always define the condition, people, place and time period before calculating. A large hospital may report more infections than a small hospital simply because it treats more patients. Comparing counts alone can therefore mislead.
Counts, Ratios, Proportions and Rates
| Measure | Meaning | Fictional example |
|---|---|---|
| Count | Number of events or people | 20 new cases |
| Ratio | One quantity divided by another; numerator need not be part of denominator | 10 male nurses to 20 female nurses = 1:2 |
| Proportion | Numerator is included in denominator | 10 male nurses among 30 nurses = 33.3% |
| Rate | Event frequency relative to observation time | 20 infections per 1000 person-years |
Terms such as attack rate and case-fatality rate are common historical labels, but their usual calculations are proportions. State the actual denominator and units rather than relying on the name alone.
Incidence: New Cases
Incidence Proportion or Cumulative Incidence
Incidence proportion = new cases during a stated interval ÷ initially disease-free people at risk. It estimates the probability of developing the condition during that interval in a defined population. Specify follow-up duration: a one-month risk and a ten-year risk are different quantities. The simple calculation assumes a well-defined cohort with sufficiently complete follow-up. If people enter, leave or have unequal observation time, survival methods or incidence rates may be needed.
Fictional worked example: A cohort includes 1000 initially disease-free people, all observed for one year. Forty develop the condition. One-year incidence proportion = 40/1000 = 0.04 = 4%. This means four new cases per 100 initially disease-free people during that year. Existing cases at baseline do not belong in this denominator.
Incidence Rate and Person-Time
Incidence rate = new cases ÷ total time at risk contributed by the population. A person contributes time until the event, loss to follow-up, death or study end, as defined by the protocol. Person-years combine observation from many people: 100 people observed for one year contribute 100 person-years if all remain at risk throughout.
Separate fictional example: Forty new cases occur during 950 person-years at risk. The incidence rate is 40/950 = 0.0421 per person-year, or 42.1 cases per 1000 person-years. This is an event rate, not a 4.21% one-year probability. Converting a rate to risk requires assumptions about hazards and competing events. Never drop the time unit.
Prevalence: Existing Cases
Point prevalence = people who have the condition on a specified date ÷ population assessed on that date. It includes new and previously existing cases. If 120 of 2000 residents have diagnosed asthma on the survey date, point prevalence is 120/2000 × 100 = 6%.
Period prevalence describes people who had the condition at any time during a defined period. Count each person once for that condition, even if they have several visits. The appropriate population denominator depends on the design; an average or mid-period population is commonly used for a changing community. Clearly state the method. Period prevalence is not simply the number of new cases.
Prevalence helps plan long-term care and service capacity. It depends on both new disease occurrence and how long people live with the condition. Under restrictive steady-state assumptions for a relatively uncommon condition, prevalence is approximately incidence rate multiplied by average duration. Improved survival can increase prevalence even when incidence falls.
Outbreak Measures
An attack proportion is the cumulative incidence during an outbreak among a defined exposed or at-risk group. If 30 of 150 initially well attendees become ill during the specified outbreak window, the attack proportion is 20%. A food-specific comparison needs the numbers who ate and did not eat that food, with illness status for both groups.
The secondary attack proportion measures new cases among susceptible contacts of primary cases during an appropriate follow-up window. Exclude primary cases from the contact denominator and account for known immunity and co-primary cases according to the investigation protocol. In a fictional household investigation, 8 secondary cases among 40 susceptible contacts give 20%. The result does not prove that every infection came from a household primary case; shared outside exposure may matter.
Mortality and Case Fatality
| Measure | Usual calculation | Question answered |
|---|---|---|
| Crude mortality rate | All deaths during a period ÷ population person-time, often approximated by mid-period population × interval | How frequently do deaths occur in this population? |
| Cause-specific mortality rate | Deaths from a specified cause ÷ population time | How much population mortality is attributed to this cause? |
| Case-fatality proportion | Deaths attributable to a disease among its cases ÷ those cases over a defined outcome period | What proportion of cases die from the disease? |
| Proportionate mortality | Deaths from one cause ÷ all deaths | What share of deaths has this cause? |
If a fictional disease causes five deaths among 100 cases with adequate outcome follow-up, case fatality is 5%. Dividing those five deaths by the entire district population would answer a different question. During an ongoing outbreak, delayed outcomes and missed mild cases can distort apparent case fatality.
Crude rates reflect the population's age structure. A community with more older residents may have higher crude mortality even with lower age-specific mortality. Age-standardized rates apply age-specific rates to a common reference distribution. They support comparison but are summary measures for a standard population, not the observed number of deaths.
Comparing Groups
In a fictional cohort, 20 of 100 exposed people and 10 of 100 unexposed people develop disease during the same follow-up. Exposed risk = 20%; unexposed risk = 10%. Risk ratio = 0.20/0.10 = 2.0: observed risk is twice as high in the exposed group. Risk difference = 0.20 − 0.10 = 0.10, or 10 percentage points: ten additional cases per 100 people.
The odds ratio compares odds. With a two-by-two table containing a exposed cases, b exposed non-cases, c unexposed cases and d unexposed non-cases, OR = ad/bc. In this cohort OR = (20 × 90)/(80 × 10) = 2.25. Odds and risk are different. An odds ratio can approximate a risk ratio when the outcome is uncommon under suitable sampling assumptions; it should not automatically be called a risk ratio. Standard case-control sampling usually does not directly provide disease risks.
Interpretation and Nursing Applications
- Check case definitions, duplicate records, missing outcomes, eligibility and denominator dates.
- Use infection counts with the appropriate patient-days or device-days when monitoring care-associated events.
- Compare like populations and consider age, access to testing and severity.
- Report confidence intervals or other uncertainty when available. A point estimate alone is incomplete.
- Do not infer causation from association alone. Confounding, selection bias, measurement error and chance may explain an observed difference.
- Explain absolute and relative differences together. Do not blame individuals or communities for population statistics.
Practice Questions with Explained Answers
- Ten new cases arise among 200 initially disease-free people followed for six months. What is the risk?
10/200 = 5% over six months. The duration is part of the answer.
- Why exclude existing cases when estimating first-onset incidence?
They cannot become first-onset cases again while already diseased. The denominator must represent people eligible for the counted event.
- Can prevalence rise while incidence falls?
Yes. Longer survival or longer disease duration can increase the number living with disease.
- Is a change from 10% to 15% five percent or five percentage points?
It is five percentage points and a 50% relative increase. These describe different comparisons.
- Does RR = 2 prove the exposure caused disease?
No. Check design, timing, bias, confounding and uncertainty before making causal conclusions.
Conclusion
Useful epidemiological measurement begins with a clear question and a suitable denominator. Incidence describes new disease, prevalence describes existing disease, mortality measures population deaths, and case fatality describes outcomes among cases. Nurses combine accurate calculations with clinical context, data-quality checks and careful communication to support sound public-health decisions.