
Introduction and Learning Objectives
A hypothesis test uses sample evidence to assess a statement about a population. Its decision can be wrong because samples vary. Type I error, Type II error and statistical power describe different outcomes of this process. Understanding them helps BSN students appraise research and understand why a nonsignificant finding does not automatically establish that an intervention has no effect.
- Identify the two errors using the truth of the null hypothesis.
- Explain alpha, beta and power for a specified study design and effect.
- Describe how sample size, variability and decision thresholds affect power.
- Interpret study findings using effect estimates and uncertainty.
Four Possible Outcomes
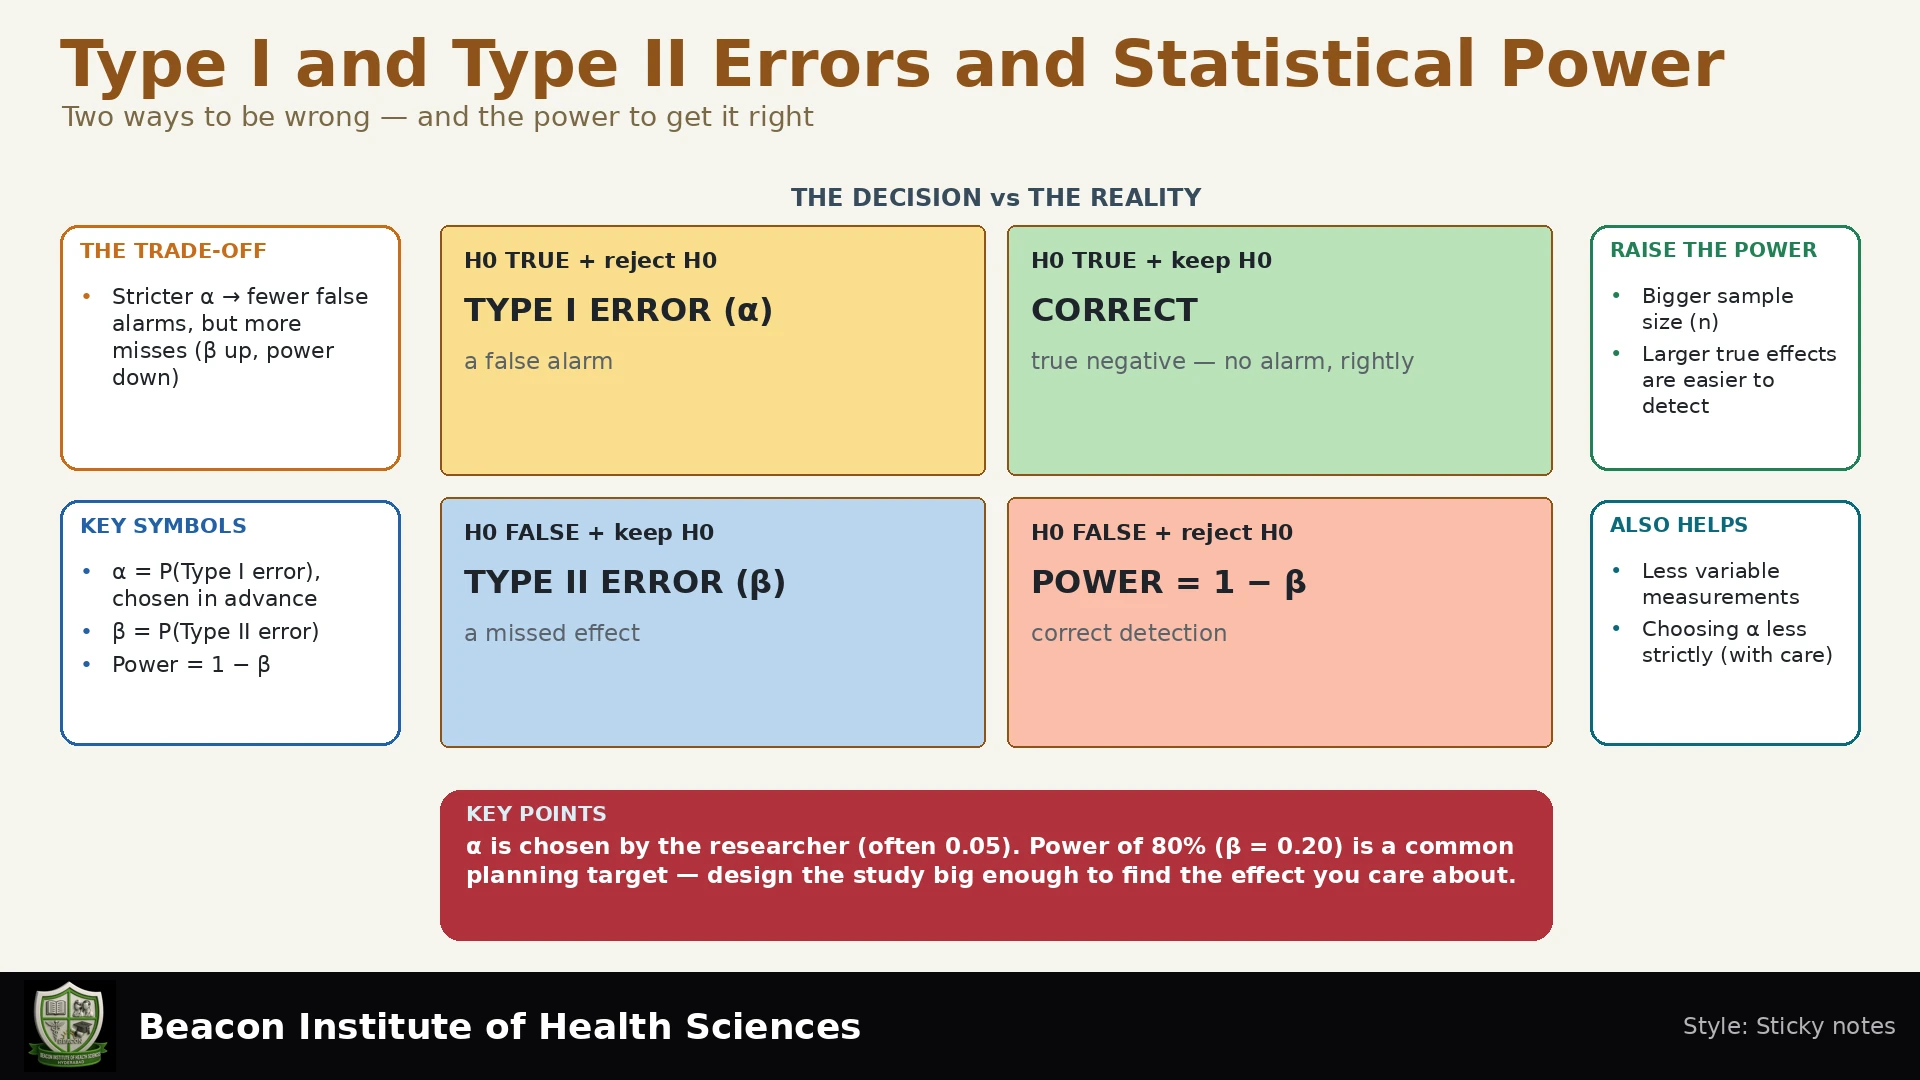
Let H0 represent the null hypothesis. In a simple comparison it may state that the population mean difference is zero. A researcher either rejects H0 or fails to reject it. The true population situation may be unknown, but it determines which outcome occurred.
| Test decision | H0 is true | H0 is false at the specified alternative |
|---|---|---|
| Reject H0 | Type I error: false rejection | Correct detection |
| Fail to reject H0 | Correct non-rejection | Type II error: missed detection |
Type I Error and Alpha
A Type I error rejects a true null hypothesis. Alpha (α) is the test's prespecified significance level, which controls its false-rejection rate under the null model. A level of 0.05 is a common illustrative choice, not an obligatory value for every study. It is not a 5% probability that the particular conclusion is false. Assumptions, repeated testing and selective reporting affect the meaning of this control.
Type II Error and Beta
A Type II error fails to reject H0 when the null is false. Beta (β) describes this probability at a specified alternative effect. It is not one fixed property independent of the true effect: a small effect is usually harder to detect than a large one with the same design. Failure to reject does not prove equality, safety or equivalence.
Statistical Power
Power = 1 − β. It is the probability that the planned test rejects H0 when the specified alternative is true, under the stated assumptions. Power of 0.80 means an 80% detection probability in that planning scenario. It does not mean an 80% probability that the hypothesis is true, that every patient benefits, or that the study is free of bias.
Worked Fictional Study-Planning Example
Imagine planning a study of two nursing teaching approaches. The outcome is a numerical knowledge score. H0 states that the population mean difference is zero. Before collecting data, the team chooses a four-point difference as its target effect for planning and selects α = 0.05. Suppose a valid calculation for the chosen design gives β = 0.20 at that target. These numbers are invented teaching assumptions, not BIHS research findings or a universal sample-size recommendation.
- Calculate power: 1 − 0.20 = 0.80, or 80%.
- If H0 is true: Among 1,000 hypothetical repetitions of a correctly calibrated test, about 50 false rejections are expected at α = 0.05. The exact number varies; 50 is not guaranteed.
- If the target alternative is true: About 800 of 1,000 hypothetical repetitions would detect it, and about 200 would miss it under the planning assumptions.
- Interpret a nonsignificant result: Examine the estimated difference and confidence interval. The data may still be compatible with an important effect, especially when the interval is wide. Do not announce that the approaches are identical merely because p exceeds 0.05.
Factors Affecting Power
| Change, with other factors held fixed | Typical consequence |
|---|---|
| Increase sample size using the same appropriate design | More precise estimates and higher power |
| Larger true effect relative to variability | Higher power to detect that effect |
| Reduce outcome variability or improve measurement precision | Often higher power |
| Use a stricter alpha threshold | Lower false-rejection allowance, usually lower power |
| Increase alpha | Usually higher power, at the cost of more Type I error |
These relationships depend on the statistical test and design. Do not change alpha after seeing the results to obtain a favorable conclusion. One-sided testing requires an appropriate scientific justification and advance planning; it must not be selected after observing the direction of the effect.
Planning a Useful Nursing Study
Specify the primary outcome, clinically or educationally meaningful target effect, anticipated variability, significance level, desired power and analysis method. Account for paired or clustered observations, allocation between groups, expected attrition and missing data. Consult a statistician for design-specific sample-size work; there is no single adequate sample size for every question.
Too little information can produce inconclusive findings and waste participants' contributions. Excessive recruitment can also consume unnecessary resources. Planning should match the importance of the question and the risks and costs of participation. High power cannot correct selection bias, confounding, poor measurement or misleading reporting.
Multiple Tests and Research Interpretation
Testing many outcomes without appropriate planning increases opportunities for false-positive findings. Prespecify primary analyses, use justified multiplicity procedures where needed and report results transparently. Distinguish planned analyses from exploratory ones.
After data collection, report effect estimates and confidence intervals rather than using “observed power” calculated from the same effect estimate as an explanation for the result. A p-value alone neither measures effect size nor establishes clinical importance. A precise estimate of a small effect and an imprecise estimate of a potentially important effect have different implications.
Practice Questions with Explained Answers
- A test rejects H0 although the true mean difference is zero. Which error occurred? Type I: a true null was rejected.
- A test fails to detect the specified genuine effect. Which error occurred? Type II: a false null was not rejected.
- If β = 0.10 at the target effect, what is power? 1 − 0.10 = 0.90, or 90%, under that planning scenario.
- Does p > 0.05 prove no effect? No. It indicates non-rejection at that threshold for the chosen test; interpret the effect estimate, interval and design.
- Can a large biased sample be trusted because power is high? No. Power concerns detection under a model, not whether sampling and measurement are valid.