
Introduction to Biostatistics
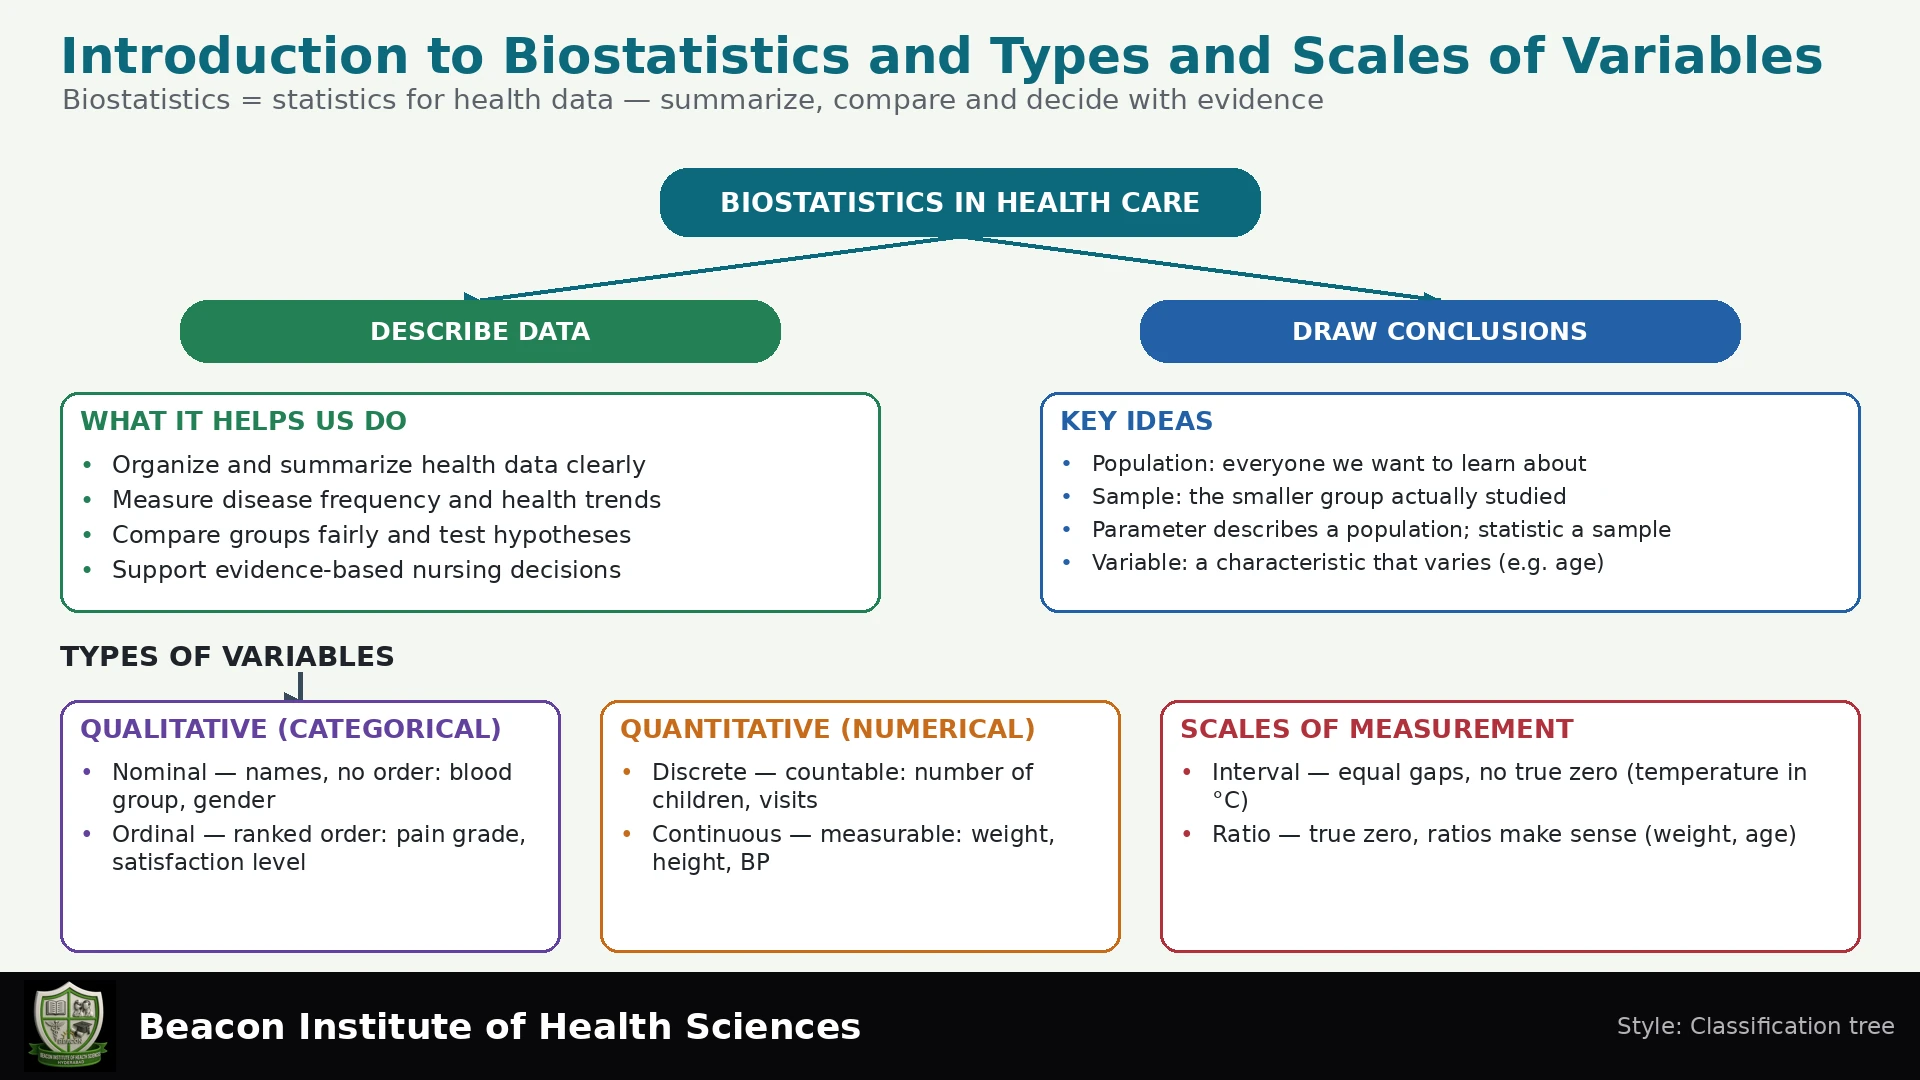
Biostatistics involves the application of statistical reasoning and methods to biology, healthcare, and public health. It encompasses the systematic processes of data collection, organization, analysis, and interpretation. A core purpose of biostatistics in nursing is to address uncertainty in clinical practice, facilitating evidence-informed care and continuous quality improvement.
Descriptive Versus Inferential Statistics
Statistical methods are broadly categorized into descriptive and inferential statistics:
- Descriptive Statistics: These methods summarize the observed data within a specific group or dataset. They provide a clear overview of the characteristics of the data collected.
- Inferential Statistics: These methods extend beyond mere description. They involve learning about larger populations by drawing conclusions from smaller samples, always acknowledging underlying assumptions and inherent uncertainty in the generalization process.
Key Statistical Concepts
Understanding fundamental concepts is crucial for working with biostatistics:
- Population versus Sample: A population refers to the entire group of individuals or items of interest, while a sample is a subset of the population selected for study.
- Parameter versus Statistic: A parameter is a numerical characteristic describing a population (e.g., the average weight of all patients in a hospital). A statistic is a numerical characteristic describing a sample (e.g., the average weight of a sample of 100 patients from that hospital).
- Observations/Cases versus Variables/Values: An observation or case typically represents a single individual or unit from whom data is collected (e.g., a patient). Each observation forms a row in a dataset. Variables are the characteristics measured or observed for each case (e.g., weight, blood pressure), forming columns. Values are the specific data points recorded for each variable.
Important Considerations in Statistical Reasoning
When interpreting statistical findings, nurses must exercise caution:
- Causation versus Association: It is crucial not to infer causation solely from an observed association between variables. Association indicates a relationship, but not necessarily a cause-and-effect link.
- Generalization of Samples: Generalizing findings from a convenience sample to a broader population should not be done automatically or without careful consideration of potential biases and representativeness.
Types of Variables
Variables are classified based on the nature of the data they represent:
- Categorical/Qualitative Variables: These variables place observations into distinct groups or categories.
- Nominal Variables: Categories have no inherent order (e.g., blood group A, B, O, AB). Numerically coded categories, such as '1' for male and '2' for female, remain nominal.
- Ordinal Variables: Categories have a meaningful order, but the differences between them are not precisely quantifiable or equal (e.g., patient satisfaction rated as low, moderate, high).
- Quantitative/Numerical Variables: These variables represent measurable quantities.
- Discrete Variables: These are counts and can only take specific, usually whole, integer values (e.g., number of falls in a month).
- Continuous Variables: These are measurements that can take any value within a given range, including fractions and decimals, limited only by the precision of the measuring instrument (e.g., measured weight in kilograms). Rounding measurements for practical purposes does not turn an underlying continuous quantity into a discrete count.
Scales of Measurement
While variable types describe the fundamental nature of data, scales of measurement describe the level of detail and mathematical operations that can be meaningfully applied to the data. Types and scales answer different questions about the data.
The Four Scales of Measurement
| Scale | Description | Examples |
|---|---|---|
| Nominal | Labels categories without any inherent order. Arithmetic on category codes does not measure an amount; category frequencies and proportions can be calculated. | Blood group (A, B, O), Marital status (Single, Married, Divorced) |
| Ordinal | Categories have a meaningful order, but the intervals between categories are not necessarily equal or quantifiable. Differences between ranks are not uniform. | Pain scale (Mild, Moderate, Severe), Patient satisfaction (Low, Moderate, High) |
| Interval | Data has meaningful order and equal differences between values, but there is no true or meaningful absolute zero point. Ratios are not meaningful. | Temperature in Celsius or Fahrenheit (40°C is not twice as hot as 20°C because 0°C is arbitrary) |
| Ratio | Data has all the properties of interval data, plus a meaningful absolute zero point, allowing for meaningful ratios between values. | Weight (40 kg is twice 20 kg), Number of falls, Age in years (age bands would be ordinal) |
It is important to note that ratio variables can be either discrete (e.g., number of falls) or continuous (e.g., weight); not all ratio variables are continuous. A single Likert item is typically considered ordinal. Treating multi-item Likert scales as quantitative requires evidence and assumptions. Similarly, numbers on a pain scale alone do not establish equal intervals or a true ratio scale.
Explanatory and Response Variables
An explanatory or independent variable is used to explain or predict variation in a response or dependent variable. These are roles within a study, separate from a variable's measurement scale. An exposure in an observational study need not be manipulated by the researcher. For example, a study might examine physical activity as an explanatory variable and recovery time as the response. Age may be a potential confounder if related to both activity and recovery; an observed association alone does not prove a treatment effect.
Learning Objectives
- Distinguish descriptive summaries from population inference.
- Identify cases, variables, values and measurement scales.
- Classify nursing data and choose sensible summaries.
- Check coding, units and missing values before analysis.
Recording and Summarizing Nursing Data
Create a data dictionary before collection: define each variable, its units, valid values, source and measurement time. Specify how unknown or missing entries are recorded. A missing falls entry is not zero falls. Keep identifiers secure and exclude them from public teaching datasets. Consistent definitions help colleagues interpret observations correctly.
Categorical data can be summarized using counts, percentages and bar charts. Preserve the order of ordinal categories; a median category may be useful where appropriate. Numerical data may use a mean and standard deviation, or a median and interquartile range when the distribution and question make these more suitable. A histogram shows a numerical distribution. Measurement scale is one guide; study design, distribution, assumptions and the research question also affect the analysis.
Worked Example: A Fictional Five-Patient Dataset
The following data are entirely synthetic and are for classroom practice. Each row is one fictional patient; falls refer to the same defined one-month observation period. These figures are not BIHS clinical results or population estimates.
| Practice ID | Weight (kg) | Falls in one month | Blood group | Satisfaction category |
|---|---|---|---|---|
| P1 | 50 | 0 | A | Low |
| P2 | 55 | 1 | B | Moderate |
| P3 | 60 | 0 | O | High |
| P4 | 65 | 2 | A | Moderate |
| P5 | 70 | 0 | O | High |
Calculations and Interpretation
- Mean weight: (50 + 55 + 60 + 65 + 70) / 5 = 300 / 5 = 60 kg.
- Patients with at least one fall: P2 and P4, so 2 / 5 × 100 = 40%. This is the percentage of patients affected, not the percentage of all fall events.
- Total falls: 0 + 1 + 0 + 2 + 0 = 3 events. Counting events answers a different question from counting people.
- Blood group O: P3 and P5, so 2 / 5 × 100 = 40%. Blood groups A and O each occur twice, making both modal categories.
- Satisfaction: Low occurs once, Moderate twice and High twice. Keeping these categories ordered communicates the pattern without assuming equal numerical gaps.
These are descriptive calculations for this dataset. Five invented observations cannot establish the fall frequency or blood-group distribution of a real hospital, community or national population. Even real sample results require attention to sampling and uncertainty before wider conclusions.
Practice Questions with Explained Answers
- What are the type and scale of weight? Quantitative continuous and ratio. Recording whole kilograms does not make the underlying measurement a count.
- What are the type and scale of falls? Quantitative discrete and ratio. Zero means no fall events during the specified period.
- Does code 2 for blood group B make blood group quantitative? No. A code is a label; its arithmetic does not describe an amount of blood group.
- What happens when ages are converted into ordered bands? The recorded variable becomes ordinal and loses the detail of exact age. Define nonoverlapping bands before collection.
- Should an unknown weight be recorded as 0? No. A fabricated zero distorts summaries. Use the agreed missing-value convention and report how missing observations were handled.
Key Takeaways
Ask what a value represents before choosing a calculation. Identify the case, distinguish counts from measurements, establish the scale and check the study context. Clear definitions and honest interpretation make statistical summaries useful for nursing learning and practice.
Introduction to Biostatistics and Types and Scales of Variables Quiz