
Learning Objectives
- Describe population size, composition, distribution and change.
- Choose suitable demographic data sources and recognize their limitations.
- Calculate and interpret basic population indicators using correct denominators.
- Apply demographic information to equitable nursing service planning.
What Demography Studies
Demography is the scientific study of human populations: how many people there are, their characteristics, where they live and how these patterns change. A population must be defined by place, time and membership rules. A district population, the people registered with a clinic and the patients attending one session are different groups.
Population size is a count. Composition describes characteristics such as age and sex as recorded by the source. Distribution describes location, density and urban or rural settlement. Population processes include births, deaths and migration. Nurses use this information to estimate service needs, plan outreach and interpret rates.
Stocks, Flows and Population Change
A stock is measured at a point in time, such as residents on a census date. A flow counts events over a period, such as births during a year. Do not compare an annual event count with an unrelated population or omit the time period.
The balancing equation is: population at the end = population at the start + live births − deaths + immigrants − emigrants. Immigration means movement into the defined area; emigration means movement out. Natural increase is births minus deaths. Net migration is immigration minus emigration. These concepts apply to districts as well as countries when boundaries and definitions are clear.
Sources of Demographic Information
| Source | Useful contribution | Important limitation |
|---|---|---|
| Population census | Detailed population and household information for a reference date | Coverage errors, changing boundaries and time since enumeration affect use. |
| Civil registration and vital statistics | Continuously records vital events such as births and deaths | Incomplete registration can underestimate events. |
| Sample survey | Detailed information from a selected sample | Sampling error, nonresponse and recall can affect estimates. |
| Administrative records | Describe registration, attendance and service activity | Service users may not represent the whole community. |
| Population estimate or projection | Updates or explores population patterns between or after observations | Depends on input data, methods and assumptions. |
Pakistan Bureau of Statistics provides official census resources. Use the date, geographic coverage and definitions attached to the particular table. A census count and a UN estimate may differ because of timing, coverage or method. Projections are conditional calculations, not promises about the future. This lecture uses fictional numbers rather than an undated national population total.
Core Measures and Correct Denominators
| Indicator | Calculation for the stated year | Interpretation |
|---|---|---|
| Crude birth rate | Live births ÷ mid-year population × 1,000 | Live births per 1,000 population |
| Crude death rate | Deaths ÷ mid-year population × 1,000 | Deaths per 1,000 population |
| General fertility rate | Live births ÷ mid-year number of women aged 15–49 × 1,000 | Births per 1,000 women in this conventional age range |
| Age-specific fertility rate | Births to women in a specified age group ÷ women in that age group × 1,000 | Fertility within that age group |
| Infant mortality rate | Deaths before age one during the year ÷ live births during the year × 1,000 | A conventional annual measure per 1,000 live births |
| Maternal mortality ratio | Maternal deaths ÷ live births in the same period × 100,000 | Maternal deaths per 100,000 live births |
Follow the source's definitions and age ranges. Maternal death has a specific definition related to pregnancy or its management during pregnancy or within 42 days of its end, excluding accidental or incidental causes. Maternal mortality ratio is not the same as a rate using women of reproductive age as the denominator.
Total fertility rate summarizes a period's age-specific fertility rates as the average number of children a woman would have if those rates applied throughout reproductive life. For five-year age groups with rates expressed per 1,000 women, multiply the sum of those rates by five and divide by 1,000. It is a synthetic period measure, not the observed completed family size of every woman.
Crude rates are affected by age composition. A population with more older residents can have a higher crude death rate even when age-specific mortality is lower. Use age-specific or appropriately standardized comparisons when the purpose requires them. Small event counts produce unstable rates and need careful interpretation.
Fictional Worked Example: Annual Change
A fictional community begins the year with 10,000 residents. During the year there are 250 live births, 80 deaths, 150 arrivals and 120 departures. Assuming complete counts and unchanged boundaries, the end-year population is 10,000 + 250 − 80 + 150 − 120 = 10,200. Natural increase is 170 and net migration is 30, giving total growth of 200 people.
Growth relative to the starting population is 200 ÷ 10,000 × 100 = 2% for this year. A simple mid-year approximation, assuming reasonably even change, is (10,000 + 10,200) ÷ 2 = 10,100. The crude birth rate is 250 ÷ 10,100 × 1,000 = 24.75 per 1,000. The crude death rate is 80 ÷ 10,100 × 1,000 = 7.92 per 1,000. Their difference describes natural increase per 1,000 and excludes migration.
These are teaching calculations. Sudden displacement, seasonal movement or incomplete registration could make the simple mid-year approximation unsuitable. State assumptions rather than present an approximate denominator as exact.
Age Structure, Dependency and Population Pyramids
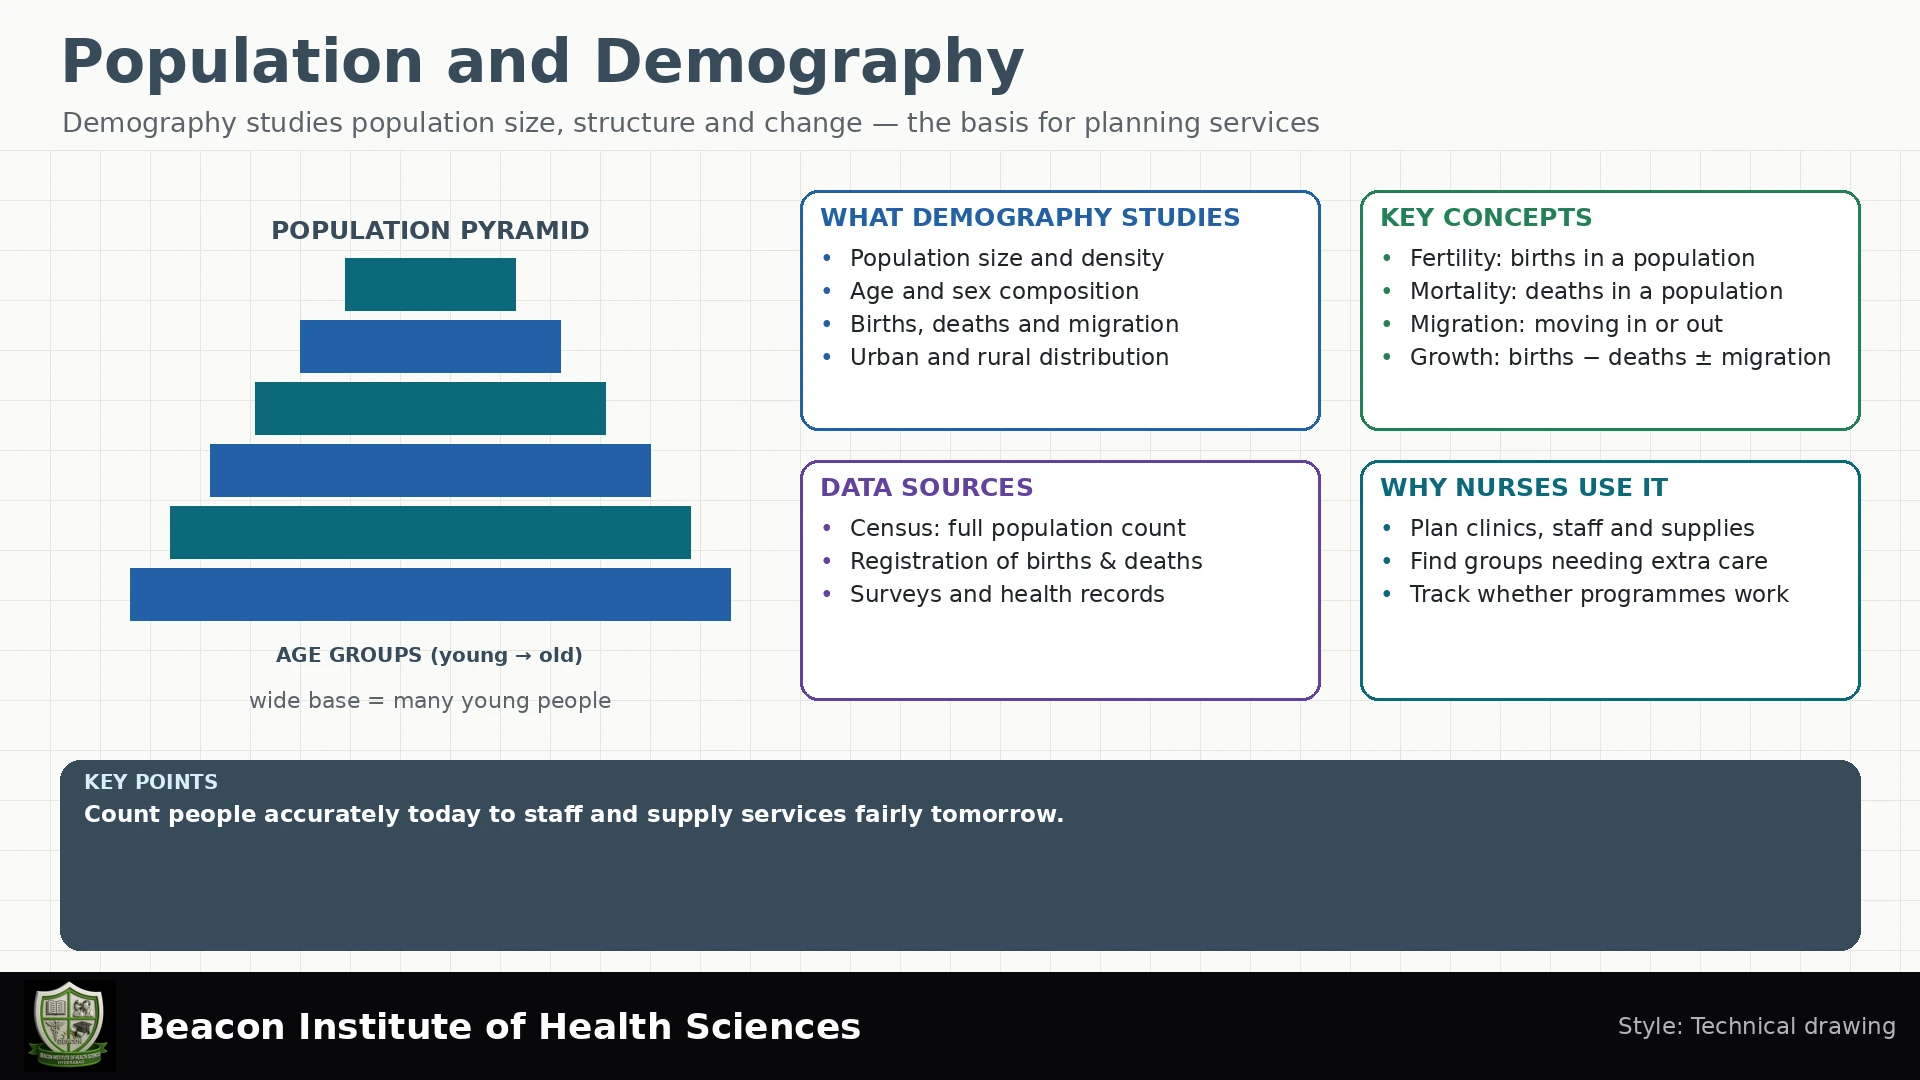
A population pyramid displays age groups, conventionally with recorded male and female populations on opposite sides. A broad base can indicate many young residents, while a larger upper portion indicates more older people. Fertility, mortality and migration all influence the shape. A pyramid alone cannot establish why a pattern occurred.
A common total age-dependency ratio is (people aged 0–14 + people aged 65 and over) ÷ people aged 15–64 × 100. It describes age structure, not actual financial dependency or employment. Some older adults work, some working-age adults need support, and unpaid care is economically important.
In a separate fictional population, 3,000 residents are aged 0–14, 600 are aged 65 or above and 6,000 are aged 15–64. The ratio is (3,000 + 600) ÷ 6,000 × 100 = 60 people in the two conventional dependent-age groups per 100 working-age residents. It is not 60% of the total population and does not count actual dependants.
Density, Migration and Urbanization
Population density is residents divided by land area, usually people per square kilometre. It does not directly measure household crowding or access to services. A low-density area may face long travel distances; a dense area may have both nearby services and serious affordability barriers.
Migration can change population size and age structure. Urban growth can result from natural increase, migration and reclassification of settlements. Avoid assuming that migrants carry disease or that all urban residents have good access. Assess language, housing, continuity of records and practical needs without stigmatizing groups.
Demographic Transition and Service Planning
Demographic transition describes broad shifts from high birth and death rates toward lower rates, with timing and pathways that vary. Mortality decline can precede fertility decline, creating a period of faster growth. Population momentum can sustain growth after fertility falls because many people enter reproductive ages. This framework is not a fixed timetable for every country.
A larger working-age share may create an opportunity for a demographic dividend, but benefits depend on education, health, decent work, gender equity and supportive institutions. Age structure alone does not guarantee prosperity. An ageing population also calls for accessible long-term care, rehabilitation and support for caregivers.
Nurses translate demographic data into age-appropriate preventive services, maternal and child health support, chronic disease care and outreach. Use the eligible population as the denominator for service coverage, check missing groups and consult communities. Reproductive health services should support informed, voluntary choices, privacy and rights; population goals do not justify coercion.
Practice Questions with Explained Answers
- Which three components change population size?
Births, deaths and migration. Net migration combines arrivals and departures.
- Why use a mid-year denominator for annual crude rates?
It approximates the population exposed during the year, provided its assumptions are reasonable.
- Does a higher crude death rate prove worse health care?
No. Age structure and other differences can affect the comparison.
- Does an age-dependency ratio measure actual unemployment?
No. It uses age groups and does not establish individual work or support status.
- Is a projection a future census count?
No. It is an estimate conditional on data and assumptions, which may change.
Conclusion
Population and demography help nurses connect individual care with community needs. Accurate interpretation requires clear boundaries, dates, definitions and denominators. Combining sound calculations with awareness of uncertainty supports fairer planning and more inclusive services.