
Learning Objectives
- Describe the data lifecycle from planning to secure archiving.
- Build clear definitions, a data dictionary and a suitable data table.
- Check errors, duplicates and missing information transparently.
- Choose appropriate tables, summaries and graphs.
- Interpret a fictional screening dataset without overstating its meaning.
Why Data Management Matters
Data management is the organized handling of information so that it remains accurate, interpretable, secure and useful. Presentation communicates findings clearly to support decisions. Nurses use both skills when documenting care, tracking follow-up, monitoring infection, planning community services and reviewing quality improvement.
A polished graph cannot repair poor definitions or missing records. Begin with the question the data must answer. Decide who is eligible, what each observation represents, what variables are necessary, how information will be collected and who may access it. Collect only what is needed for the authorized purpose.
The Data Lifecycle
- Plan: define objectives, responsibilities, variables and ethical requirements.
- Collect: use suitable tools and consistent procedures.
- Validate and clean: check records, resolve discrepancies and document changes.
- Store and protect: use approved systems, access controls and backups.
- Analyse: select summaries and comparisons suited to the design.
- Present and interpret: show denominators, uncertainty and limitations.
- Archive or dispose: follow the applicable retention and disposal policy.
The process is iterative. An analysis may reveal a date inconsistency that requires checking the original record. Preserve the original information and document the correction instead of silently rewriting history.
Sources and Types of Data
Primary data are collected first-hand for the current purpose, such as a structured community survey. Secondary data were collected for another purpose, such as existing hospital records, census tables or registered births and deaths. Check whether definitions, time periods, coverage and permissions fit the present question.
| Type | Example | Suitable summary |
|---|---|---|
| Nominal categorical | Screen result: positive, negative, unknown | Counts and clearly defined percentages |
| Ordinal categorical | Ordered categories of functional limitation | Category distribution; median may be meaningful depending on coding |
| Discrete numerical | Number of visits | Counts, median or mean with appropriate spread |
| Continuous numerical | Weight or systolic blood pressure | Mean and standard deviation for a suitable distribution, or median and interquartile range |
| Date or time | Symptom-onset date | Time trends and intervals after validity checks |
Numeric codes do not automatically make a variable quantitative. If 1 means positive and 2 means negative, their arithmetic average has no useful clinical meaning. Record the coding scheme so every user interprets values consistently.
Data Dictionary and Table Structure
A data dictionary states each variable's name, meaning, type, allowed values, units, source and missing-value rule. Operational definitions specify how concepts are measured. For example, define whether age is recorded at enrolment and whether it is in completed years or months.
| Variable | Definition and format | Validation |
|---|---|---|
| Study ID | Unique project identifier | Required and unique for one-person records |
| Screen date | Date assessment was performed, YYYY-MM-DD | Valid calendar date within the activity period |
| Screen result | Positive, negative or unknown under the specified test protocol | Only defined categories |
| Referral completed | Documented completion within the defined follow-up window | Yes, no, unknown or not applicable as defined |
Use one row per observational unit and one column per variable. In a one-person survey, one row represents one person. In repeated-visit data, one row may represent a visit and a person identifier links visits. Define this structure before deduplicating: repeated visits are not automatically duplicate people.
Keep values in separate cells, avoid merged cells in the analysis table and use consistent units. Use a separate lookup table for codes when needed. Maintain a stable identifier rather than relying only on names.
Validation, Cleaning and Missing Data
- Check required fields, allowable categories, date formats, units and plausible ranges.
- Examine distributions and extreme values. An unusual result may be real; verify it before correcting or excluding it.
- Check logical relationships, such as a follow-up date preceding enrolment.
- Identify possible duplicates using appropriate identifiers and context, then review before removal.
- Record missingness explicitly. Unknown, not measured, not applicable and a genuine zero have different meanings.
- Keep a cleaning log with the record, original value, revised value, reason, source and responsible person.
Do not replace a missing blood-pressure value with zero or an invented average. The handling of missing data depends on the analysis plan and why values are missing. Report how many values are absent. Excluding incomplete records can bias findings if missingness is related to health, exposure or access to care.
Preserve a protected raw dataset and create a separate working copy for analysis. Use version names and documented procedures so results can be reproduced. Recheck totals and calculations after changes. Avoid manually changing a chart without updating the data that produced it.
Confidentiality and Security
Use approved storage, appropriate authentication, role-based access and secure transfer methods. Keep the identity linkage file separate from the analysis dataset when practical. A coded dataset can still be identifiable if the key exists or combinations of details reveal a person; coding is not the same as full anonymization.
Use access-appropriate backups and test restoration according to organizational policy. Keep devices and software maintained through approved processes. Do not put identifiable patient data into public links, personal messaging groups or unapproved analysis tools. Follow current retention rules and authorized disposal procedures rather than inventing a universal retention period.
Choosing a Presentation
| Display | Best suited to | Key precaution |
|---|---|---|
| Frequency table | Exact category counts and percentages | State denominator and missing values |
| Bar chart | Comparing categories | Usually start the numerical axis at zero; label units |
| Histogram | Distribution of a numerical variable | Use meaningful intervals and explain unequal bin widths if used |
| Line graph | Measurements or rates over ordered time | Use consistent intervals and identify gaps |
| Epidemic curve | Case counts by symptom-onset interval | Distinguish onset from report date and show the time scale |
| Scatterplot | Relationship between two numerical variables | Association does not establish causation |
| Map | Geographical patterns | Population size and confidentiality can distort interpretation |
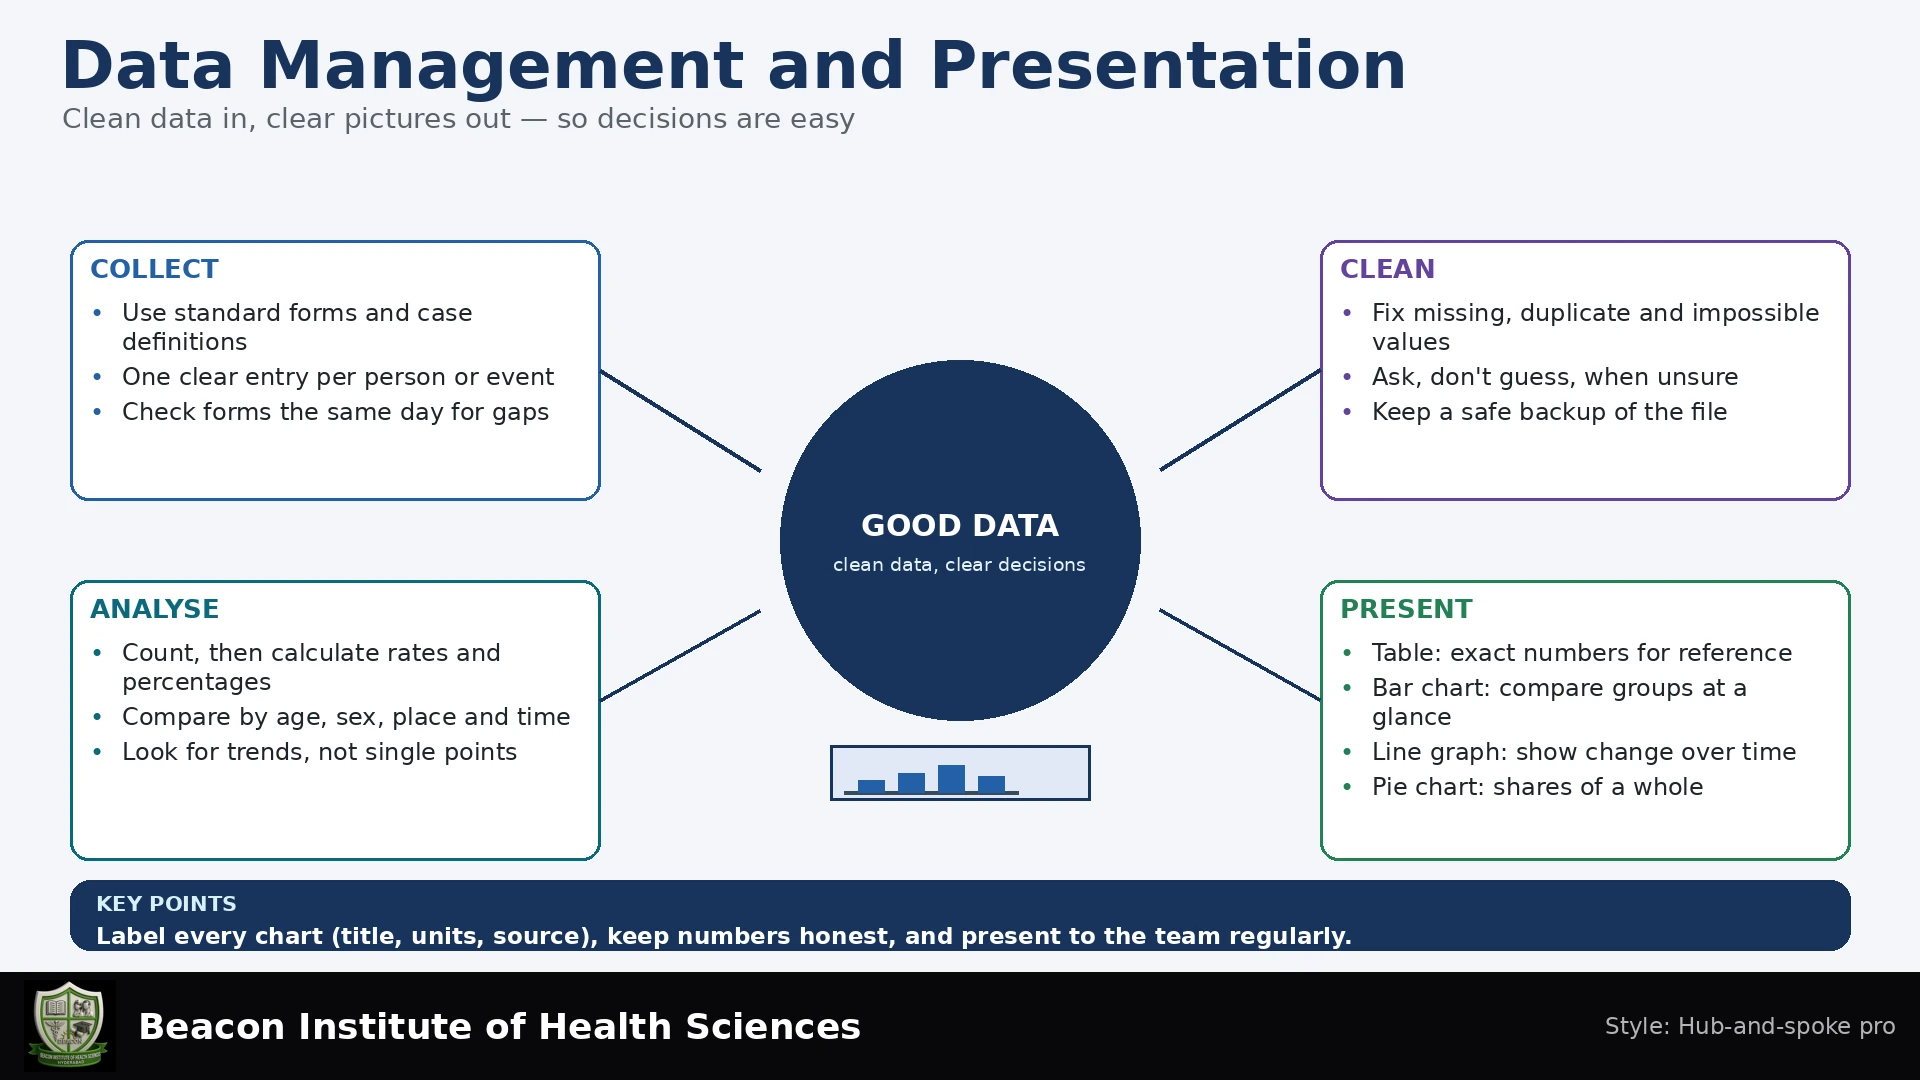
Give each display a clear title stating the subject, setting and period. Label rows, columns, axes, units and sources. Include definitions and relevant footnotes. Avoid three-dimensional effects, distorted axes and decorative elements that hide comparisons. Use readable contrast and avoid relying on colour alone.
Counts describe workload. Rates permit comparisons that account for population size and time. A district with more cases may simply have more residents. Age composition, case definitions and reporting completeness also matter. Do not mix percentages calculated from different denominators without explaining them.
Fictional Worked Dataset
A nurse reviews ten fictional people invited to a screening activity. Eight have documented results: three positive and five negative. Two results are missing. No real patient information is used.
| Result | Count | Percentage of all ten records | Percentage of eight known results |
|---|---|---|---|
| Positive | 3 | 30% | 37.5% |
| Negative | 5 | 50% | 62.5% |
| Unknown | 2 | 20% | Not included |
| Total | 10 | 100% | 100% of known results |
Result completeness = 8/10 × 100 = 80%. Positivity among known results = 3/8 × 100 = 37.5%. The three positive records are also 30% of all ten records, but that is a different denominator. Neither value establishes disease prevalence: screening is not diagnostic confirmation, and the group may not represent the wider population.
Suppose five invitees are from area A: two positive, two negative and one unknown. Five are from area B: one positive, three negative and one unknown. Known-result positivity is 2/4 = 50% in A and 1/4 = 25% in B. With such small, selected numbers and unknown outcomes, the apparent difference is highly uncertain and cannot establish an area effect.
The nurse should investigate why results are missing, verify data entry, ensure appropriate follow-up for positive screens and report the limitations. Missing results must not be reclassified as negative merely to simplify the table.
Nursing Applications
Accurate records support medication safety, infection monitoring, vaccination follow-up and continuity of care. Use standardized definitions across shifts and facilities. Share useful summaries with the team, explain what each indicator measures and connect findings to realistic action, such as retrieving missing results or improving referral access.
When evaluating improvement, compare equivalent populations, periods and definitions. A chart showing fewer events after a change is descriptive evidence; seasonality, changing workload, reporting practice and other factors may contribute. Match claims to the design and uncertainty.
Practice Questions with Explained Answers
- Why is unknown different from zero?
Zero means a measured absence or count of none. Unknown means the value was not established.
- What is positivity among known results in the example?
3/8 = 37.5%. The denominator is eight documented results.
- Can 37.5% be called community disease prevalence?
No. The result is screening positivity in a small selected group, with missing data and no diagnostic confirmation.
- Which graph shows a continuous variable's distribution?
A histogram can show the distribution using appropriate numerical intervals.
- Should every repeated identifier be deleted?
No. Repeated visits may be valid. Define the observational unit and review records before removing duplicates.
Conclusion
Reliable data management connects clear definitions, accurate collection, transparent cleaning and secure storage. Good presentation makes denominators, missingness and limitations visible. Nurses use these practices to turn information into safer care and better service decisions without overstating what the data can show.