
1. Purpose and learning objectives
Objectives: organize fictional data, use basic formulas and functions, distinguish cell references, create charts and validate results. Excel is a spreadsheet application. It supports academic calculations, inventories and quality-improvement exercises, but an ordinary workbook is not an approved patient record or validated medication calculator. All exercise data are fictional and not clinical guidance.
2. Workbook and worksheet concepts
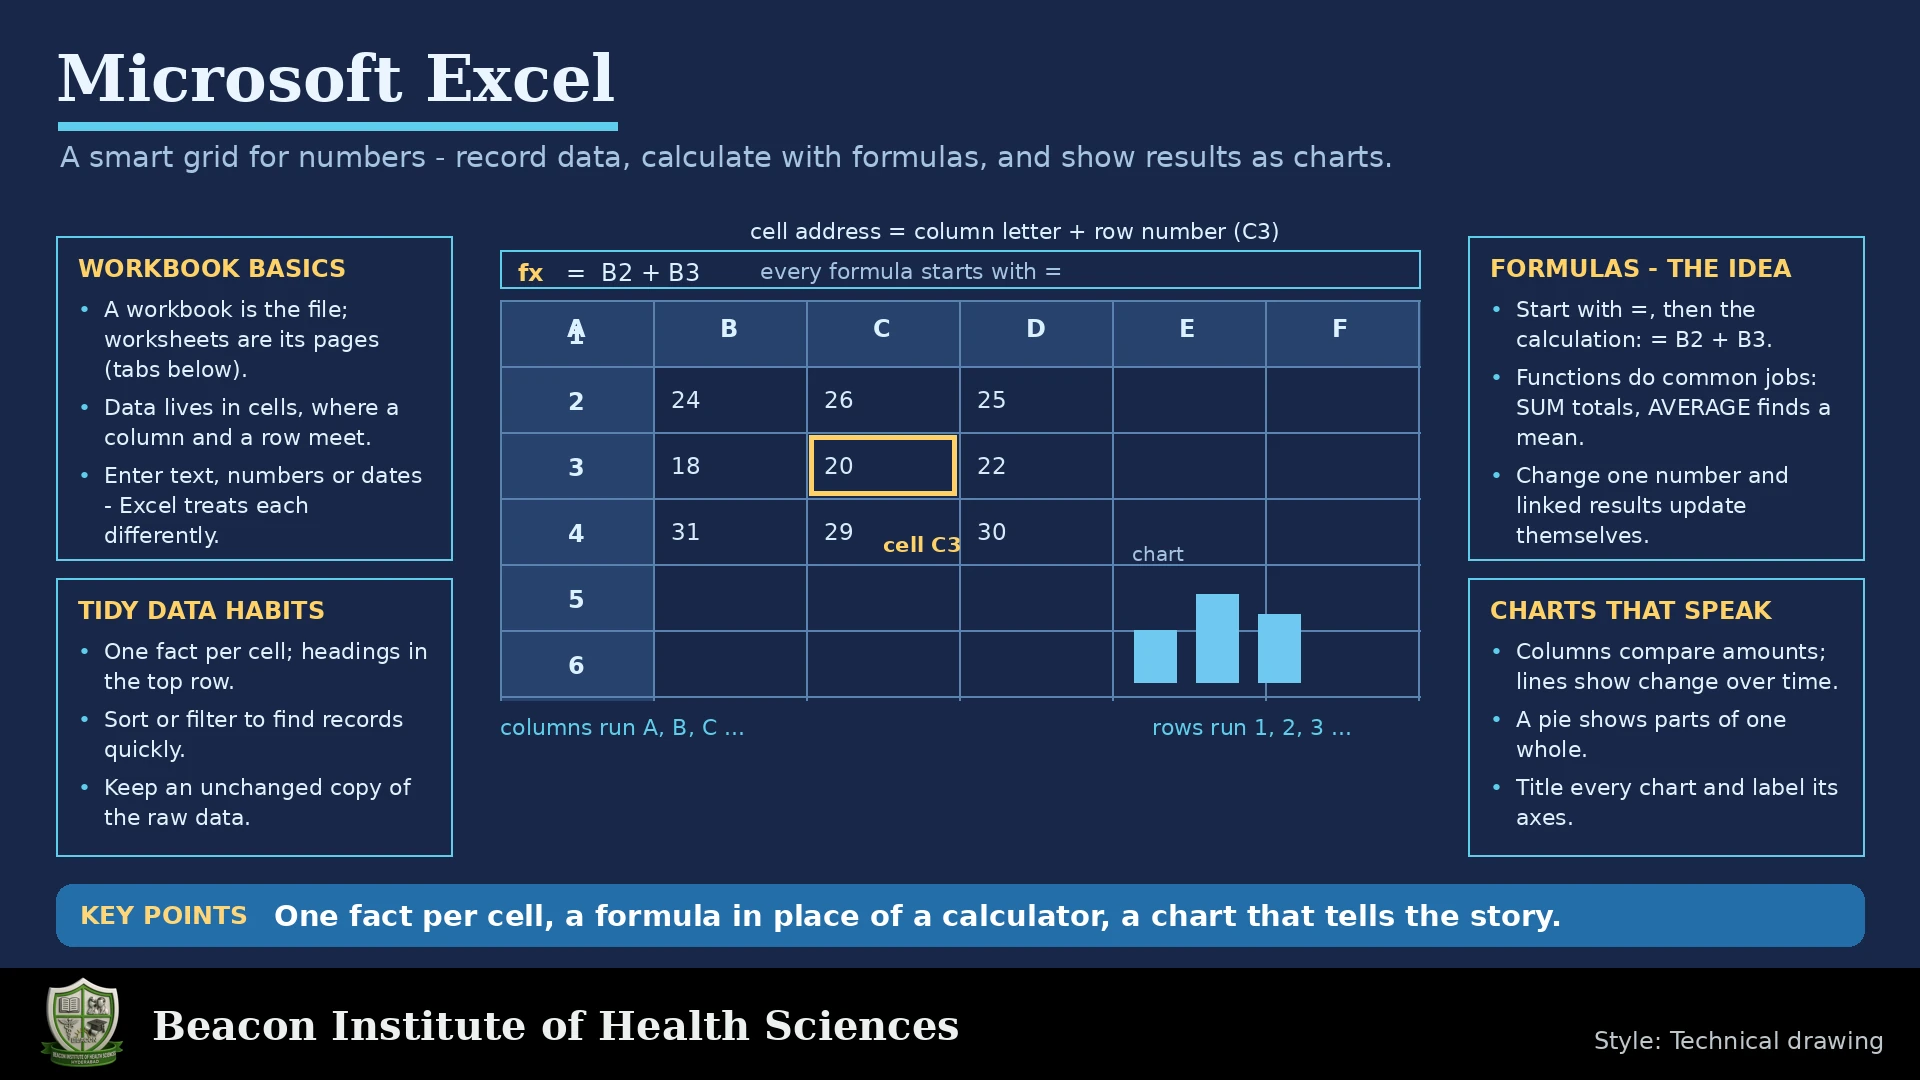
A workbook contains worksheets. Columns use letters and rows use numbers. B3 identifies column B, row 3; B3:B7 is a range. A cell may hold text, a number, date or formula. Formulas usually start with equals. The formula bar shows the underlying entry, while formatting controls its display. A displayed rounded number may retain extra precision.
3. Designing reliable data
Design data carefully: one row per observation, one column per variable and a single clear header row. Include units, dates and definitions. Avoid blank rows within a dataset and merged cells in data tables. Use consistent codes and distinguish missing values from zero. Zero means an observed quantity of none; a blank may mean unknown.
4. Saving and file formats
Save early using an informative filename. .xlsx is a common editable workbook format. CSV stores plain tabular values for one sheet and does not preserve workbook formatting, charts or all features. Verify exported files. Use approved storage and backups. Do not paste patient identifiers into personal spreadsheets or send them through unapproved services.
5. Formulas and functions
Arithmetic example: enter fictional stock quantities 12, 15 and 18 into B2:B4. =SUM(B2:B4) gives 45, =AVERAGE(B2:B4) gives 15, =MIN(B2:B4) gives 12 and =MAX(B2:B4) gives 18. =COUNT(B2:B4) counts numeric cells. Explain what is being averaged; adding incompatible units is meaningless even when Excel calculates it.
6. Relative and absolute references
References: relative references adjust when copied. Absolute reference $E$1 remains fixed. Mixed references lock either the row or column. If B2 contains fictional quantity and C2 unit price, =B2*C2 calculates a row cost. If E1 contains a fixed multiplier, =D2*$E$1 preserves it when copied. Inspect several copied rows rather than assuming the pattern stayed correct.
7. Percentages and denominators
Percentages: a fraction of 0.25 displayed as percent becomes 25 percent. Typing 25 and then applying percent formatting can produce 2500 percent. For 18 of 24 fictional students attending, =18/24 gives 0.75, displayed as 75 percent. Include the denominator and period; percentages without context can mislead. Do not average percentages with unequal denominators without considering weighting.
8. Logical tests with IF
Simple logical function: =IF(B2>=50,"Pass","Review") demonstrates a fictional classroom rule. It is not an approved clinical threshold or student-assessment policy. IF tests a condition and returns one of two results. State the rule clearly and check values on both sides of the boundary. Never use an example formula to make real clinical decisions.
9. Sorting, filtering and validation
Sorting and filtering: sorting rearranges rows; filtering displays selected records. Sort the full table so names or identifiers do not detach from their values. Verify a few rows afterward. Filtered-out rows are not deleted. Data validation can limit input choices but does not prove accuracy, and pasted content may need separate checking.
10. Choosing charts
Charts: a column chart compares categories, a line chart shows changes over ordered time and a scatter plot explores paired numerical measurements. Include units, appropriate scales and sources. Avoid three-dimensional effects that distort perception. A trend does not prove causation. Use fictional lab-class attendance, not identifiable clinical data, for practice.
11. Checking errors and calculations
Quality checks: compare a small result with manual arithmetic, check ranges and confirm included rows. Inspect hidden rows and filters. #DIV/0! often indicates division by zero or a blank denominator; #VALUE! may involve an unsuitable data type; #REF! signals an invalid reference; #### may indicate insufficient column width or another display issue. Fix the cause instead of hiding errors.
12. Practical inventory assignment
Practical task: create a five-item fictional classroom inventory with item, quantity, unit price and cost. Calculate each cost, total quantity and total cost. Add a fixed discount multiplier in a separate cell and use an absolute reference. Sort by item without breaking rows, create a column chart and preview printing. Write the units and verify two rows manually.
13. Protection and privacy
Protection and privacy: worksheet protection can limit accidental editing but is not the same as encryption or access control. Share through approved permissions, minimize data and document assumptions. Track versions and keep formulas visible for reviewers where appropriate. Do not trust a spreadsheet simply because it looks professional.
14. Answered review and recap
Answered practice: What does $E$1 do? Fixes row and column. Why does 0.25 display as 25 percent? Percent format multiplies the displayed value by 100. Is blank the same as zero? No. Why sort the whole table? To preserve record relationships. Which formula totals B2:B4? =SUM(B2:B4). Recap: define data, calculate carefully, validate results and protect information.
15. Worked learning activities and final checks
A complete fictional inventory example uses notebooks, folders and pens with quantities 10, 8 and 20 and unit prices 100, 50 and 20 in a stated currency. Row costs are 1000, 400 and 400, so total cost is 1800. Total quantity is 38 items, but adding different types of items is meaningful only if the purpose is an overall item count. To compare spending, use row costs rather than quantities alone.
Check formulas by changing one test input in a practice copy. If notebook quantity changes from 10 to 11, notebook cost should change from 1000 to 1100 and the total from 1800 to 1900. Restore the original value after the check. This tests the formula's response and reveals whether a total was typed manually instead of calculated. Document which cells contain inputs and which contain formulas.
For a denominator exercise, two fictional groups have attendance of 9 out of 10 and 10 out of 20. The group percentages are 90 percent and 50 percent. Their combined attendance is 19 out of 30, approximately 63.3 percent, not the simple average of 70 percent. The unequal group sizes explain the difference. Always decide what quantity is being summarized before choosing a formula.
A reviewer's checklist includes units, missing-data rules, valid ranges, copied references, filters, hidden rows and unexpected text values. A chart should be checked against its underlying table. Keep a small worked example in the workbook or accompanying notes so another student can understand the logic. These checks support academic spreadsheet work; clinical calculators require separate approved validation and governance.