
Learning Objectives
- Explain epidemiological transition and its historical framework.
- Distinguish changes in disease patterns from demographic and nutrition transitions.
- Interpret counts, proportions and rates without confusing them.
- Plan nursing responses to overlapping infectious and chronic disease burdens.
Meaning and Importance
Epidemiological transition means long-term change in the population distribution of illness, disability and causes of death. Historically, many populations experienced falling mortality from infection and rising importance of noncommunicable diseases such as cardiovascular disease, cancer, diabetes and chronic respiratory disease. This is a framework for understanding change, not a rule that every society follows the same path.
Several processes can occur together. Fewer children may die from infection while more adults survive into ages when chronic conditions are common. Better treatment may allow people to live longer with disease. Injuries, mental health conditions, maternal health needs and infection outbreaks can remain important. The transition concerns populations; it does not describe a person progressing from one disease to another.
Omran's Historical Framework
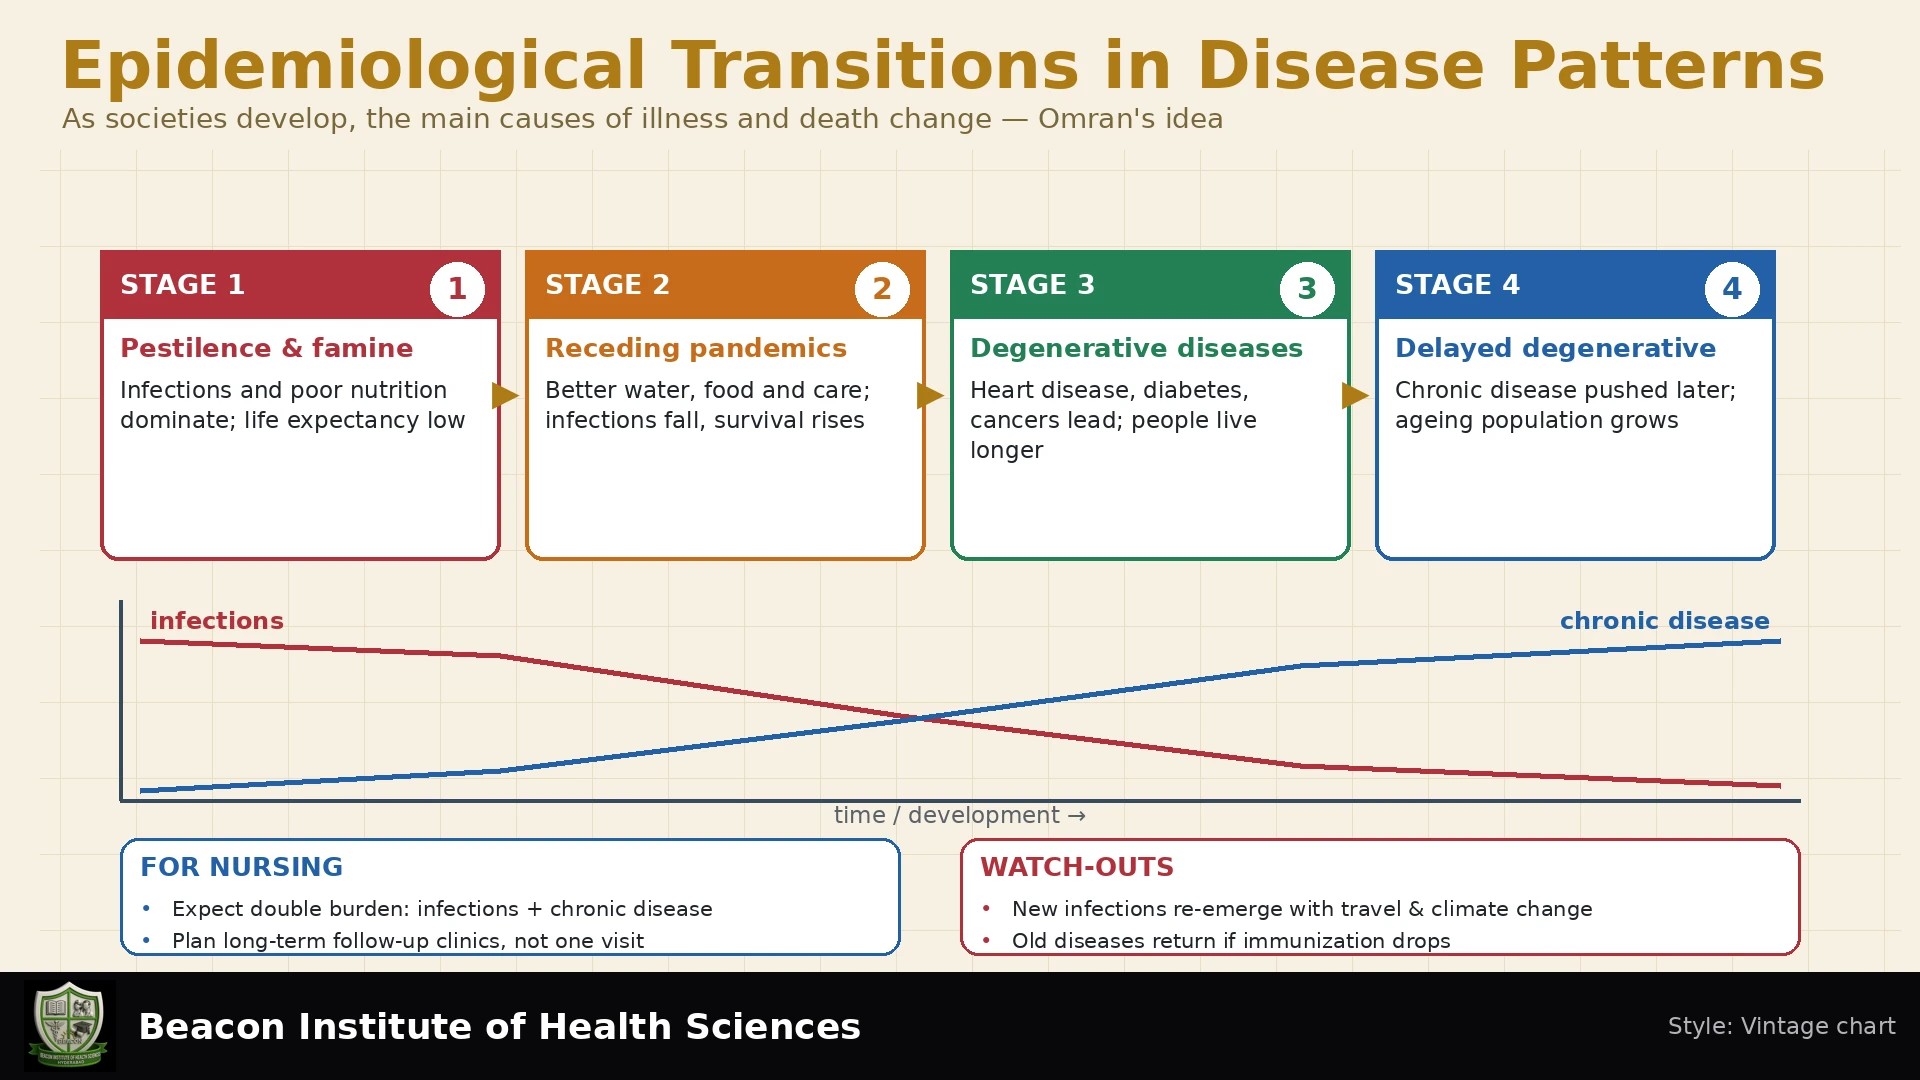
Abdel Omran's 1971 theory described three broad historical ages. The original labels below are historical terms. They should not be used to rank cultures or blame people for illness.
| Historical age | Broad pattern | Interpretation today |
|---|---|---|
| Age of pestilence and famine | High, fluctuating mortality, with infection, food insecurity and short average life expectancy | Conditions reflect social and environmental vulnerability, not personal failure. |
| Age of receding pandemics | Mortality declines as major epidemic impacts lessen and survival improves | Sanitation, nutrition, living conditions, public health and care contribute in different ways. |
| Age of degenerative and man-made diseases | Chronic conditions become prominent and deaths occur at older ages | Modern discussion uses precise terms such as NCDs, injuries and environmental or occupational harms. |
The framework simplified complex histories. Later authors described additional patterns, including delayed chronic-disease mortality and emerging or re-emerging infections. There is no single universally accepted sequence of extra stages. Avoid assigning a country one rigid stage without current, detailed evidence.
Related Transitions
| Concept | What changes? | Example |
|---|---|---|
| Epidemiological transition | Illness, disability and mortality patterns | Greater need for long-term diabetes care |
| Demographic transition | Mortality, fertility, population growth and age structure | Falling fertility and an increasing share of older adults |
| Nutrition transition | Diet, activity and nutritional status | Changing food systems with undernutrition and obesity coexisting |
These changes interact but are not interchangeable. A population may age while still experiencing substantial communicable disease. Overweight does not exclude micronutrient deficiency. Averages can hide very different conditions between districts, income groups and households.
Why Disease Patterns Change
Living Conditions and Public Health
Safe water, sanitation, adequate nutrition, housing and vaccination can reduce infectious disease. Better maternal and child services can improve survival. Conversely, disruption of these services through displacement, flooding or conflict can increase risk again. Progress is neither automatic nor irreversible.
Ageing and Survival
When more people survive into older age, chronic conditions become more visible in service demand. Better treatment can increase the number living with a condition because patients survive longer. A rise in prevalence therefore does not always mean the rate of new disease has increased.
Commercial, Environmental and Social Conditions
Tobacco, unhealthy food environments, physical inactivity, harmful alcohol use and air pollution contribute to NCD risk. Urbanization may improve access to care while also increasing crowding, pollution or barriers to physical activity. Work conditions, education, income and discrimination shape both exposure and access to prevention. Explain these influences without reducing disease to individual lifestyle choices alone.
Overlapping Burdens and Reversals
A double burden commonly describes coexistence of communicable diseases and NCDs. Some discussions use triple burden when injuries or another major group is added; always define the categories being used. One label cannot fully describe mental health, reproductive health, disability and other important needs.
A person can have tuberculosis and diabetes at the same time. A community may require childhood immunization, outbreak response and long-term cardiovascular care together. New pathogens, antimicrobial resistance, climate hazards and interrupted services can change established trends. An apparent decline in notified infection may also reflect reduced testing or reporting rather than true improvement.
Measuring the Transition Carefully
Counts show service workload. Cause-of-death proportions show the share of all deaths assigned to each cause. Crude rates relate events to population size and time. Age-specific rates compare people in the same age bands. Age-standardized rates apply age-specific rates to a common reference age distribution so comparisons are less influenced by population ageing.
A higher proportion of NCD deaths does not automatically mean the NCD mortality rate increased. The share may rise because deaths from other causes fell. Check coding changes, completeness of death registration, diagnostic access and the population denominator before interpreting a trend.
Disability-adjusted life years combine years of life lost due to premature death (YLL) and years lived with disability (YLD): DALY = YLL + YLD. They summarize fatal and nonfatal burden using specified methods and assumptions. They are not simply counts of patients and should be interpreted alongside lived experience, uncertainty and local service needs.
Fictional Worked Example
The table describes two separate one-year periods in a fictional district. It is a teaching example, not Pakistan surveillance data.
| Measure | Earlier year | Later year |
|---|---|---|
| Mid-year population | 100,000 | 120,000 |
| All deaths | 1000 | 900 |
| NCD deaths | 500 | 540 |
| Other deaths | 500 | 360 |
Earlier NCD mortality = 500/100,000 × 100,000 = 500 deaths per 100,000 population per year. Later NCD mortality = 540/120,000 × 100,000 = 450 per 100,000 per year. The NCD count rose from 500 to 540, but the crude NCD mortality rate fell because population growth was larger.
The NCD share of deaths rose from 500/1000 = 50% to 540/900 = 60%. Therefore, a higher share and count can coexist with a lower crude rate. Overall crude mortality also fell from 1000 to 750 per 100,000 per year. Without age-specific data, we cannot determine whether age-standardized NCD mortality improved. No intervention effect is established by this before-and-after description.
Nursing Applications
- Maintain vaccination and infection-prevention work alongside chronic-disease services.
- Assess multimorbidity, medication access, nutrition, function and mental health together.
- Offer person-centred education suited to literacy, language, income and home circumstances.
- Coordinate continuity of care, referrals, rehabilitation and support for family caregivers.
- Use local, dated data to plan staffing and supplies; separate counts from rates.
- Identify groups missed by services and help reduce transport, cost and accessibility barriers.
Practice Questions with Explained Answers
- Does transition mean infection disappears?
No. Infection can persist, recur or emerge alongside chronic conditions.
- Why can prevalence increase when treatment improves?
Longer survival increases time lived with disease and can increase the number of existing cases.
- In the fictional example, did NCD mortality increase?
The count and share increased, but the crude rate fell. Age-standardized change remains unknown.
- Can one country have several patterns at once?
Yes. Age, geography, income, environment and access to care create important differences within countries.
- What should a nurse conclude from fewer notified infections?
First check testing, reporting completeness, case definitions and population change. Fewer reports alone do not prove lower incidence.
Conclusion
Epidemiological transition describes changing population health needs. Its value lies in helping nurses prepare for overlapping diseases and longer-term care, while maintaining prevention and outbreak readiness. Sound interpretation uses appropriate measures, recognizes unequal living conditions and avoids assuming that change is uniform or irreversible.