
Learning Objectives
Upon completing this lecture, BSN students and nursing educators will be able to:
- Define epidemiology and explain its scope, focusing on populations, distribution by person, place, and time, and determinants of health.
- Discuss the application of epidemiology beyond infectious diseases to include chronic diseases, injuries, and health service evaluation.
- Differentiate between individual clinical care and the population perspective in healthcare.
- Describe descriptive, analytic, and experimental epidemiological approaches, including cross-sectional, cohort, and case-control studies, and randomized trials.
- Explain the distinction between association and causation, recognizing factors like bias and confounding.
- Identify patterns of disease occurrence such as endemic, epidemic, outbreak, and pandemic.
- Understand the importance of case definition and surveillance, including data sources and reporting mechanisms.
- Calculate and interpret key measures of disease frequency: incidence proportion, incidence rate, and point prevalence.
- Outline the steps involved in an outbreak investigation.
- Describe the vital roles of nurses in epidemiological activities and disease prevention.
- Distinguish between primary, secondary, and tertiary levels of disease prevention.
What is Epidemiology?
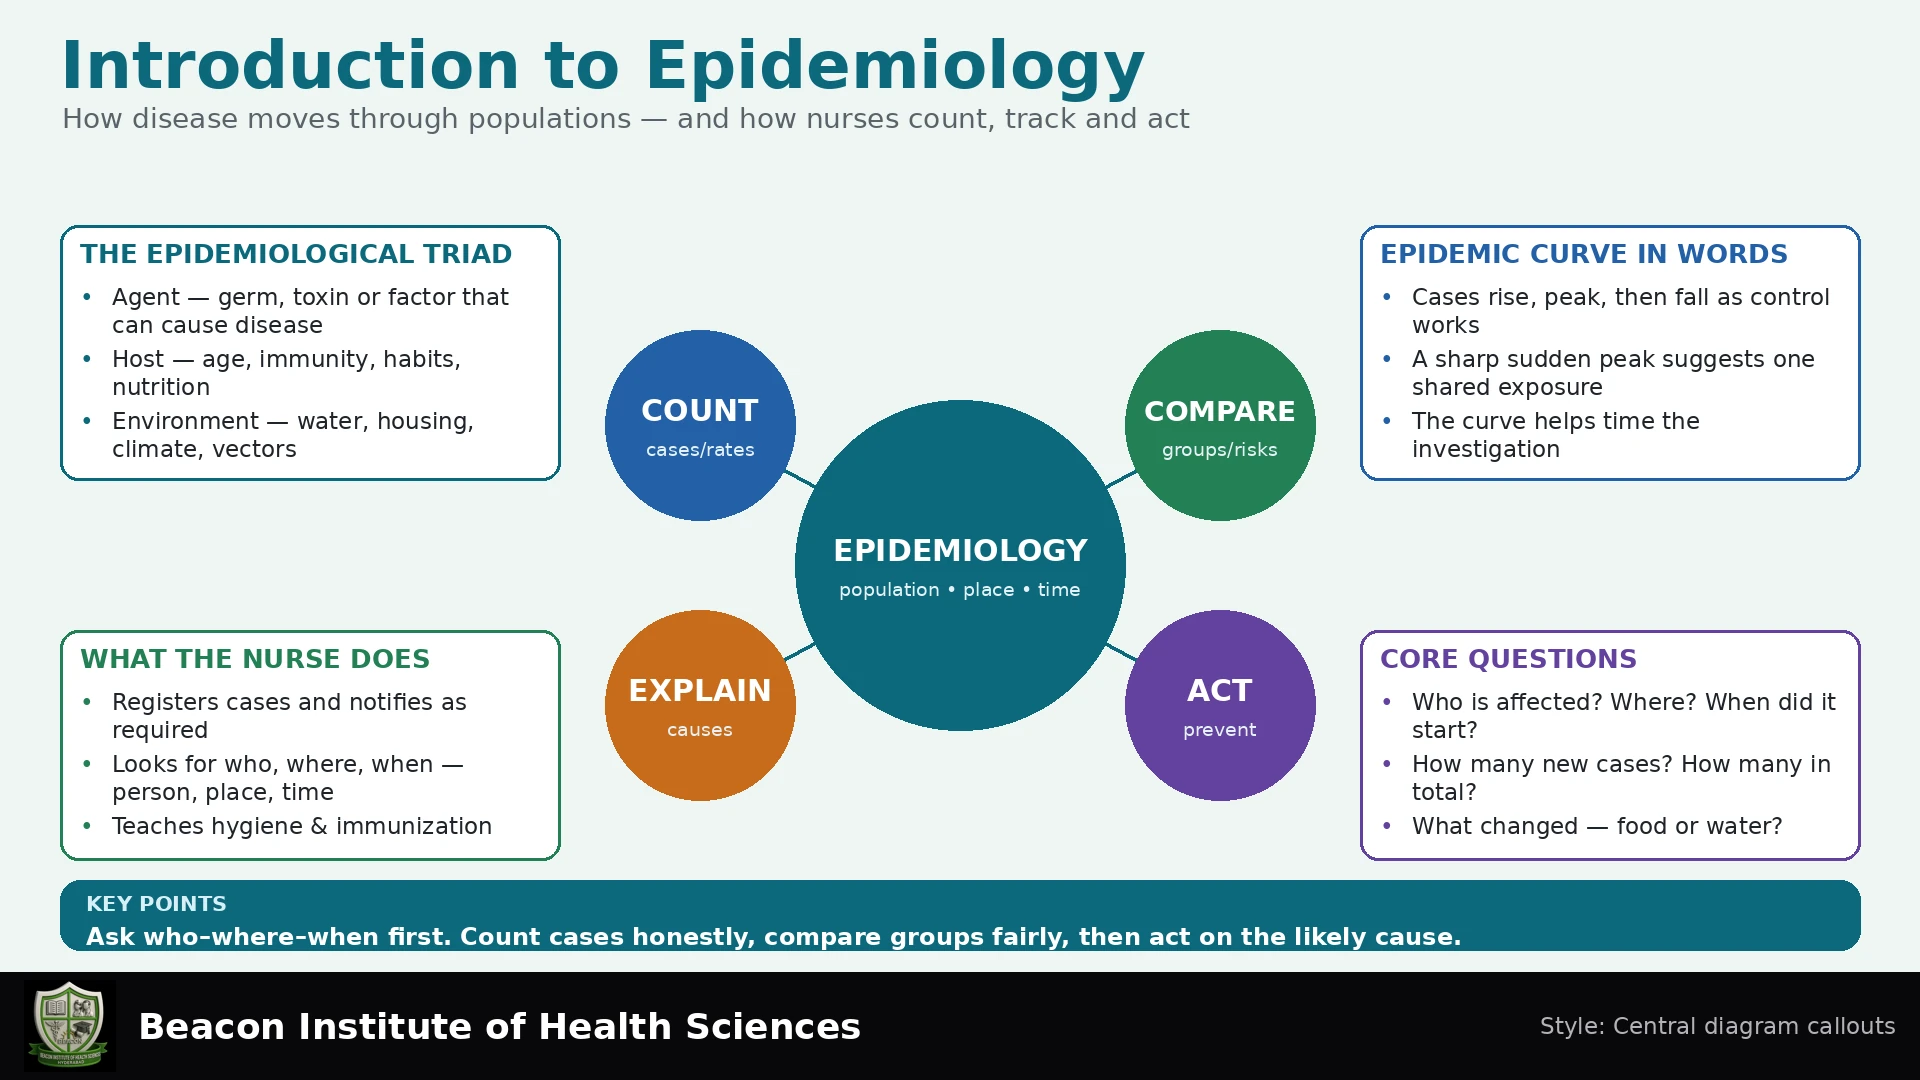
Epidemiology is fundamentally the study of the distribution and determinants of health-related states or events in specified populations, and the application of this study to the control of health problems. It is a cornerstone of public health, providing a scientific basis for preventing disease and promoting health.
Scope of Epidemiology
The scope of epidemiology is broad and encompasses several key aspects:
- Populations: Unlike clinical medicine, which focuses on individual patients, epidemiology examines health patterns within groups of people.
- Distribution: This refers to how often health events occur and where they are found in a population. Epidemiologists analyze this distribution by considering characteristics of:
- Person: Who is affected (e.g., age, sex, race, socioeconomic status).
- Place: Where the health event occurs (e.g., geographical location, urban/rural, specific institutions).
- Time: When the health event occurs (e.g., trends over years, seasonal variations, rapid increases).
- Determinants: These are the causes and other factors that influence the occurrence of health-related states or events. Identifying determinants helps to understand why certain populations are affected and others are not.
- Application to Prevention and Control: The ultimate goal of epidemiological study is to inform effective strategies for preventing and controlling health problems.
It is crucial to recognize that the application of epidemiology extends far beyond only infectious diseases. It is equally vital for understanding and addressing chronic diseases (like heart disease, diabetes, and cancer), injuries (such as motor vehicle accidents or falls), and the evaluation of health services and programs.
Complementary Perspectives: Individual Care vs. Population Health
While clinical individual care focuses on diagnosing and treating a single patient's disease, epidemiology takes a population perspective. These two approaches are not mutually exclusive; rather, clinical individual care complements the population perspective. A nurse providing direct patient care is focused on the individual's recovery and well-being, whereas an epidemiologist or public health nurse considers how to prevent similar conditions in the wider community or identify common factors contributing to a patient's illness that might affect others.
Core Epidemiological Approaches
Epidemiological studies employ different approaches to investigate health phenomena:
Descriptive epidemiology
Descriptive work asks what happened, how much, when, where and among whom. Counts, proportions, rates, maps and time plots reveal patterns and generate hypotheses. Counts need context: 30 cases in a large population may represent a lower risk than 10 cases in a much smaller population. Define the population and period before making comparisons.
Analytic and experimental approaches
Analytic studies compare groups to examine possible explanations. Experimental studies assign an intervention and observe outcomes. Random allocation can reduce confounding on average, but it does not remove all error. Trials require appropriate ethical review, consent and safeguards.
| Design | Starting point | Use and limitation |
|---|---|---|
| Cross-sectional | Measure exposure and outcome at a time or period. | Useful for prevalence; temporal order is often uncertain. |
| Cohort | Compare outcome occurrence in groups classified by exposure. | Can estimate incidence and risk comparisons. Data may be collected prospectively or from historical records. |
| Case-control | Select people with the outcome and suitable controls; compare exposure histories. | Useful for uncommon outcomes. Usually estimates an exposure odds ratio; incidence cannot ordinarily be calculated directly from sampled cases and controls. |
| Randomized trial | Assign an intervention by chance. | Evaluates an intervention under an ethical protocol; missing outcomes and applicability still matter. |
Association and causation
A difference between groups may reflect a causal effect, chance, selection bias, measurement error or confounding. Confounding occurs when another factor distorts an exposure–outcome comparison. For example, age may differ between comparison groups and also relate to the outcome.
A cause must precede its effect, but temporal order alone does not prove causation. Ask whether measurements were consistent, groups comparable and uncertainty reported. Statistical significance does not repair a biased design. A group association does not establish why a particular individual became ill.
Patterns of occurrence
Endemic means the usual presence or expected occurrence in a defined setting. An epidemic involves occurrence above what is expected for the population, place and time. Outbreak often refers to a localized epidemic. A pandemic involves widespread international spread; the term alone does not specify clinical severity.
The agent–host–environment triad is useful for understanding communicable disease: an agent, a susceptible host and conditions enabling exposure interact. It is not a complete explanation for every health problem. Social conditions, networks and multiple interacting causes may require broader models.
Measuring disease frequency
State the outcome, numerator, denominator, population and time reference. The following examples use separate fictional datasets, not actual patient records.
| Measure | Calculation | Meaning |
|---|---|---|
| Incidence proportion | New cases during a period ÷ people initially at risk. | The proportion developing the condition over the specified period, under the follow-up conditions. |
| Incidence rate | New cases ÷ person-time at risk. | The pace of new occurrence per unit of person-time. |
| Point prevalence | Existing cases at a moment ÷ the population at that moment. | The proportion currently living with the condition. |
Worked example 1: incidence proportion
Two hundred initially disease-free people at risk are all followed for one month. Twenty develop the defined condition. Incidence proportion = 20 ÷ 200 = 0.10 = 10% over one month. The period is essential. This is not prevalence. Loss to follow-up or changing eligibility would require additional consideration.
Worked example 2: point prevalence
On a survey day, 30 of 500 people have the condition. Point prevalence = 30 ÷ 500 = 0.06 = 6% on that day. Count both new and previously existing cases present then. Prevalence depends on occurrence and duration; higher prevalence does not necessarily imply higher current incidence.
Worked example 3: incidence rate
Ten new cases occur during 250 person-years at risk. Incidence rate = 10 ÷ 250 = 0.04 per person-year = 4 cases per 100 person-years. Person-time sums eligible observation time across participants. This is not a 4% annual probability.
Fictional outbreak comparison
Consider 70 attendees with complete exposure and illness information during a defined follow-up period. All were initially at risk. These invented numbers illustrate a calculation and do not describe a real outbreak.
| Food exposure | Ill | Not ill | Total |
|---|---|---|---|
| Exposed | 12 | 28 | 40 |
| Not exposed | 3 | 27 | 30 |
| Total | 15 | 55 | 70 |
Exposed attack risk = 12 ÷ 40 = 30%. Unexposed attack risk = 3 ÷ 30 = 10%. “Attack rate” is a conventional outbreak term, but this calculation is an incidence proportion rather than a person-time rate.
Risk ratio = 0.30 ÷ 0.10 = 3. The observed risk was three times as high among exposed attendees during this period. Risk difference = 30% − 10% = 20 percentage points, not a 20% relative increase.
This association suggests a hypothesis; it does not prove that the food caused illness. Investigators must examine timing, other exposures, case ascertainment, laboratory findings, bias and uncertainty. A comparison needs more than a numerical calculation to justify a causal conclusion.
Surveillance and case definitions
Public health surveillance connects ongoing collection, analysis and interpretation of health information with communication and action. Data sources include clinical and laboratory reports, surveys, census information and vital registration. Passive surveillance relies on routine reporting; active surveillance seeks information directly; sentinel surveillance uses selected reporting sites.
A case definition provides consistent criteria for counting cases. Depending on purpose, it may combine clinical or laboratory findings with person, place and time restrictions. Suspected, probable and confirmed categories may be appropriate. A surveillance definition supports comparable counting; it does not replace clinical judgment or determine every treatment decision.
Check completeness, duplicate records, timeliness and denominator quality. More testing or changed reporting may raise recorded case counts without a matching rise in true occurrence. Clinic data may miss people unable to access care. Interpret changes in the context of how the information was collected.
Investigating a suspected cluster
- Verify the signal and clinical information, compare with expected occurrence and alert the responsible team.
- Develop a suitable case definition and identify cases systematically.
- Prepare a secure line list containing necessary information, such as onset time, relevant exposures and case classification.
- Describe person, place and time, using an epidemic curve where useful.
- Develop and test hypotheses with appropriate comparisons and supporting evidence.
- Implement suitable controls, communicate findings and evaluate the response.
These activities often overlap. Urgent protective action need not wait for every investigation step. Work within the authorized clinical and public health response. Avoid speculative public claims that identify or blame individuals or communities.
Nursing applications and prevention
Nurses recognize unusual patterns, make accurate observations, support case finding and report through approved channels. Infection prevention, education, referral and follow-up connect individual care with population protection. Reporting routes and requirements depend on the setting and applicable local arrangements; this lecture does not prescribe a legal notification deadline.
Primary prevention aims to prevent onset, such as appropriate vaccination or safer water. Secondary prevention seeks early detection and timely management through suitable screening or case finding. Tertiary prevention limits complications and supports function, including rehabilitation. Choose interventions according to evidence, individual needs and relevant guidance.
Protect confidentiality by collecting necessary information, securing records and sharing only through authorized routes. Public tables should not identify people, including indirectly through very small groups. Explain findings clearly and consider barriers to care rather than interpreting every difference as an individual failing.
Common errors to avoid
- Comparing counts without considering population size.
- Omitting the time period from a risk estimate.
- Calling a person-time rate a percentage probability.
- Using only new cases to calculate point prevalence.
- Assuming association proves causation.
- Treating a change in reporting as definite evidence of a new outbreak.
Self-check with explained answers
1. Which measure describes existing cases on a survey day?
Answer: Point prevalence. Include all cases present then and the corresponding population denominator.
2. Does 4 cases per 100 person-years mean a 4% probability?
Answer: No. A rate has person-time units; risk is a proportion over a specified period. They are related but not interchangeable.
3. Does the fictional risk ratio of 3 establish the cause?
Answer: No. It describes an observed association. Timing, alternative explanations, data quality and uncertainty require assessment.
Glossary and conclusion
Population at risk: people eligible to develop the outcome. Determinant: a factor influencing occurrence. Bias: systematic error. Confounding: distortion of a comparison by another factor. Person-time: summed eligible observation time. Case definition: consistent counting criteria.
Epidemiology turns well-defined population observations into questions and actions for prevention. Nurses apply it by counting consistently, choosing the right denominator, specifying time, comparing fairly, protecting privacy and interpreting evidence cautiously.