
Understanding the Fundamentals of Hypothesis Testing
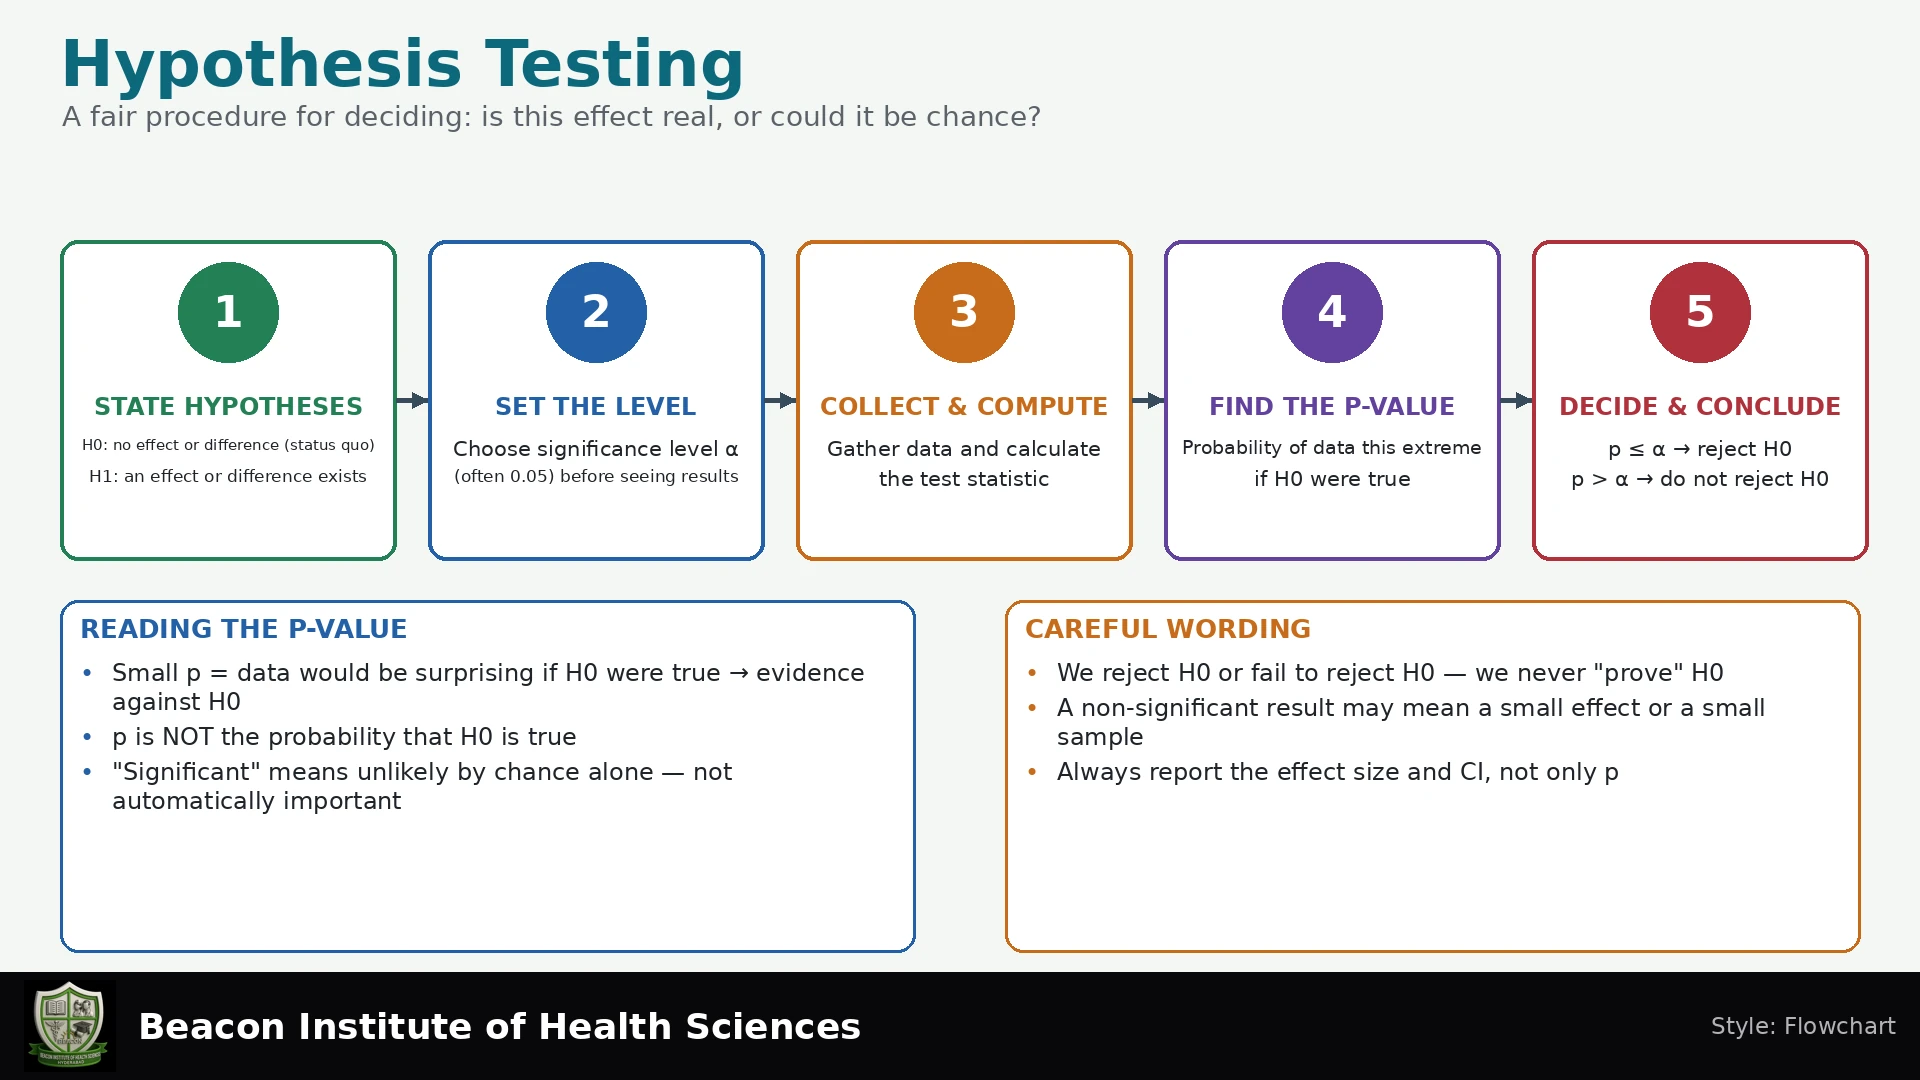
Hypothesis testing is a fundamental statistical method used to make inferences about population parameters based on sample data. For Bachelor of Science in Nursing (BSN) students, understanding this process is crucial for interpreting research, understanding evidence-based practice, and critically appraising medical literature. This lesson outlines the core concepts and steps involved.
The Null and Alternative Hypotheses
At the heart of hypothesis testing are two opposing statements about a population parameter:
- Null Hypothesis (H0): This is the statement of no effect, no difference, or no relationship. It typically states that a population parameter (e.g., mean, proportion) is equal to a specific value. For example, H0: μ = 40.
- Alternative Hypothesis (H1): This is the statement that contradicts the null hypothesis. It represents what the researcher is trying to find evidence for. The alternative hypothesis can be one-sided (e.g., μ > 40 or μ < 40) or two-sided (e.g., μ ≠ 40), indicating a difference in either direction.
Setting the Significance Level (Alpha)
Before any data analysis, a significance level, denoted as alpha (α), is chosen. This pre-set value represents the maximum probability of making a Type I error (false positive). Commonly, α is set at 0.05, meaning there is a 5% risk of incorrectly rejecting a true null hypothesis. The choice of alpha is a critical design decision in the study.
Key Assumptions and Test Selection
Appropriate test selection is vital and depends on several factors, including the type of data, the research question, and the underlying assumptions about the population distribution. Considerations include whether samples are paired or independent and the nature of the outcome variable (e.g., continuous, categorical).
Interpreting the P-value: What It Is and Is Not
The p-value is a crucial output of hypothesis testing, but its interpretation requires precision:
- What the P-value IS: It is the probability of observing results at least as extreme as, or more extreme than, the observed data, assuming that the null hypothesis (H0) is true and the statistical model is correct.
- What the P-value IS NOT:
- It is NOT the probability that the null hypothesis (H0) is true.
- It is NOT the probability that the results are due to chance alone.
- It does NOT indicate the magnitude or importance of an observed effect.
Decisions, Errors, and Power in Hypothesis Testing
Making a Decision: Reject or Fail to Reject
After computing the test statistic and its corresponding p-value, a decision is made based on a comparison with the pre-set alpha level:
- Reject the Null Hypothesis (H0): If the p-value is less than or equal to alpha (p ≤ α), we reject H0. This suggests there is sufficient evidence to support the alternative hypothesis.
- Fail to Reject the Null Hypothesis (H0): If the p-value is greater than alpha (p > α), we fail to reject H0. This means there is not enough evidence to support the alternative hypothesis. this does not establish that H0 is true or that the groups are equivalent.
Learning Objectives
- Write hypotheses about a population parameter.
- Explain a p-value under a specified null model.
- Follow a planned decision rule and report uncertainty.
- Distinguish statistical findings from causal and clinical conclusions.
Errors and Statistical Power
| True situation | Reject H0 | Fail to reject H0 |
|---|---|---|
| H0 is true | Type I error | Correct non-rejection |
| H0 is false at a specified alternative | Correct detection | Type II error |
Power is the probability of detecting a specified effect with the planned test: 1 − β, where β is the Type II error probability for that alternative. It depends on the effect, variability, sample size, threshold and design. A nonsignificant finding from an imprecise study can still be compatible with an important benefit or harm.
Complete Synthetic Worked Example
This invented example uses a known population SD to teach a z-test. It is not a BIHS clinical study. Assume an independent random sample of 36 waiting times, a sample mean of 44 minutes and a known population SD of 12 minutes. Assume the sample mean has an approximately normal distribution under the model. Test a benchmark mean of 40 minutes using a prespecified two-sided α = 0.05.
- Hypotheses: H0: μ = 40 minutes; H1: μ ≠ 40 minutes. The hypotheses concern the population mean, not the already observed sample mean.
- Standard error: SE = σ / √n = 12 / √36 = 2 minutes.
- Test statistic: z = (44 − 40) / 2 = 2.
- Two-sided p-value: A standard normal upper-tail probability at z = 2 is approximately 0.02275. Counting both equally extreme tails gives p ≈ 2 × 0.02275 = 0.0455.
- Decision: Since 0.0455 ≤ 0.05, reject H0 under the planned rule. The data provide evidence against μ = 40 in this model; they do not prove a cause for the difference.
- Matching 95% confidence interval: 44 ± 1.96 × 2 = 44 ± 3.92, or 40.08–47.92 minutes. This interval excludes 40, agreeing with this two-sided test.
- Context: The estimated difference from the benchmark is four minutes. Whether that matters operationally requires a meaningful service target, costs and study context. A threshold crossing alone cannot answer that question.
Known population SD is a teaching assumption. In practice, the SD is commonly estimated and a suitable t-test or another design-appropriate analysis may be needed. Paired observations, clustering and categorical outcomes require different methods and assumptions.
Transparent Research Reporting
Choose the research question, primary outcome, test direction and significance level before examining results. Report the effect estimate, interval, exact p-value where appropriate, sample size, assumptions and any missing observations. State when an analysis is exploratory. Repeatedly trying tests or selecting only favorable outcomes can increase false-positive findings.
Statistical significance is not a measure of effect magnitude or clinical importance. A large study may detect a small difference; a small study may be too imprecise to exclude an important difference. Observational associations also require attention to confounding and selection bias before any causal interpretation.
Practice Questions with Explained Answers
- Does p = 0.0455 mean a 4.55% chance that H0 is true? No. It describes how unusual a result this extreme would be under H0 and the statistical model.
- What if p = 0.20 at α = 0.05? Fail to reject H0. Do not replace that statement with proof of no difference.
- Can the alternative be changed to one-sided after seeing the result? No. Direction is part of the planned analysis and needs advance justification.
- Why report a confidence interval? It describes estimation uncertainty and helps readers consider the range of effects compatible with the method and data.