
Understanding Estimation in Nursing Statistics
In nursing research and evidence-based practice, estimation is a fundamental statistical concept used to infer population characteristics from sample data. This process is crucial for making informed decisions about patient care and healthcare interventions.
Point Estimates
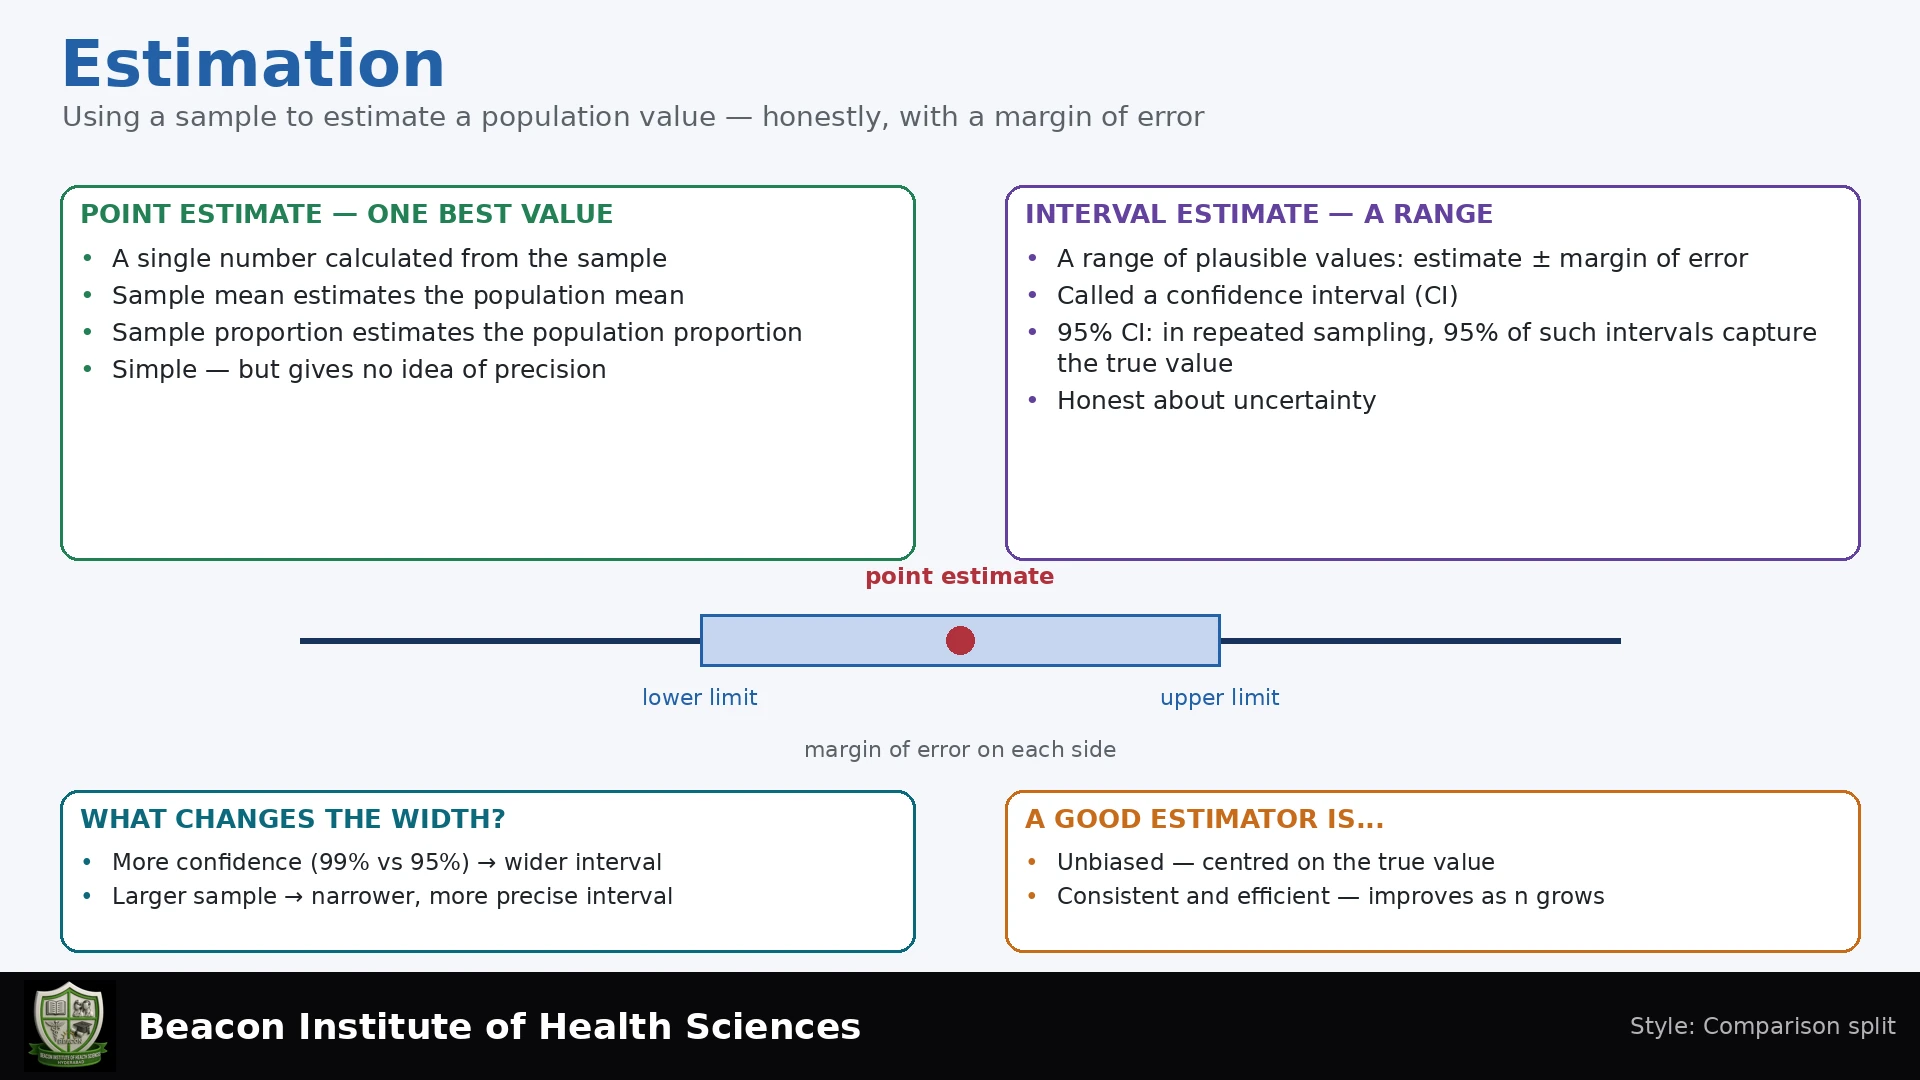
A point estimate is a single value that represents the best guess for a population parameter. Common point estimates include the sample mean, which estimates the population mean, and the sample proportion, which estimates the population proportion.
Interval Estimates
While point estimates offer a single value, they do not convey the inherent uncertainty associated with estimating a population parameter. Interval estimates, such as confidence intervals, provide a range of values within which the true population parameter is likely to lie, along with a measure of confidence in that range.
The Concept of Confidence Intervals (CI)
A confidence interval (CI) is a range of values calculated from sample data that is likely to contain the true value of an unknown population parameter. Understanding the interpretation of a CI is vital:
- The confidence level refers to the long-run proportion of times that this method of constructing intervals would produce an interval that contains the true population parameter, assuming the study design and statistical model are appropriate.
- It is not the probability that a fixed population parameter lies within a single, realized interval. Once an interval is calculated, the parameter either is or is not within it; the frequentist 95% label describes the procedure rather than a posterior probability for this fixed parameter.
- A confidence interval is not a range for individual values within the population, but rather a range for the population parameter itself.
Formulating Interval Estimates: The General Approach
Many introductory symmetric confidence intervals have the following form; other methods may produce asymmetric intervals:
Estimate ± Critical Value × Standard Error (SE)
Here, the 'Estimate' is the point estimate (e.g., sample mean or proportion), the 'Critical Value' is determined by the desired confidence level and the sampling distribution, and the 'Standard Error' quantifies the precision of the estimate.
Selecting the Appropriate Critical Value
Choosing the correct critical value is essential for accurate interval estimation:
For Means with Known Population Standard Deviation (Sigma)
When the population standard deviation (σ) is known, the z-score from the standard normal distribution is used as the critical value.
For Means with Unknown Population Standard Deviation (Sigma)
More commonly in nursing research, the population standard deviation is unknown. In such cases, the t-distribution is used. The critical value is a t-score, which depends on the degrees of freedom (df), calculated as n - 1 (where 'n' is the sample size). This approach is appropriate when there is independence among observations and the population is approximately normal or the sample size is sufficiently large to invoke the Central Limit Theorem.
For Proportions
When estimating proportions, specific methods are recommended. For small counts, the Wilson method or exact methods are preferred over the universal Wald method, which can be inaccurate with small sample sizes or extreme proportions.
Worked Example: Estimating a Population Mean
Let's consider a synthetic independent random sample to illustrate the calculation of a confidence interval for a population mean:
- Sample Size (n): 25
- Sample Mean: 40
- Sample Standard Deviation (s): 10
- Assumed Population Distribution: Approximately normal
Steps:
Calculate the Standard Error (SE):
SE = s / sqrt(n) = 10 / sqrt(25) = 10 / 5 = 2Determine the Degrees of Freedom (df):
df = n - 1 = 25 - 1 = 24Identify the Critical Value (t-score):
For a 95% confidence interval (meaning 0.025 in each tail), with 24 degrees of freedom, the t-value (t24, 0.975) is 2.064.Calculate the Margin of Error:
Margin of Error = Critical Value × SE = 2.064 × 2 = 4.128Construct the Confidence Interval:
Confidence Interval = Sample Mean ± Margin of ErrorCI = 40 ± 4.128CI = (35.87, 44.13)
Therefore, based on this sample, we are 95% confident that the true population mean lies between 35.87 and 44.13.
Factors Influencing Confidence Interval Width
The width of a confidence interval is influenced by several factors:
- Confidence Level: A higher confidence level (e.g., 99% vs. 95%) will result in a wider confidence interval because a broader range is needed to be more confident that the interval captures the true parameter.
- Sample Size (n): Increasing the sample size (assuming all other factors remain constant) will generally lead to a narrower confidence interval, as larger samples provide more precise estimates.
It is important to remember that the a simple margin of error does not capture selection bias, systematic measurement error or bias from missing data. Clustering and complex sampling can be addressed with design-appropriate methods; ignoring them can give misleading standard errors.
Important Considerations and Clinical Relevance
In healthcare, applying statistical estimation requires careful consideration:
- Relative Risk (RR): For measures like Relative Risk, a null value of 1 indicates no difference or effect, while for other tests, a difference of 0 indicates no effect.
- Imprecise CIs: An imprecise confidence interval (one that is very wide) might contain values indicating both important benefits and important harms. In such cases, the statistical findings may be inconclusive regarding the clinical significance of an intervention.
- Statistical vs. Clinical Relevance: Nurses must distinguish between statistical significance (a test result meeting a prespecified threshold under its null model) and clinical relevance (a finding that is practically important for patient care). An estimate might be statistically significant but not clinically meaningful, or vice-versa, especially if the CI is wide or includes clinically trivial effects.
Key Study Points for BSN Students
When studying estimation, focus on understanding the underlying concepts and how to apply the formulas. These lessons are designed for full worked questions and understanding statistical principles, not for directly establishing normal ranges for individual patients, which involves broader clinical assessment.
Test Your Knowledge
Ready to test your understanding of estimation? Take our quiz to reinforce your learning!
Learning Objectives and Explained Practice
By the end of this lesson, identify a point estimate, calculate an appropriate interval and explain what its confidence level means.
- What is the point estimate in the example? The sample mean, 40 minutes. The interval adds information about uncertainty in the population mean under the stated assumptions.
- Why use t rather than simply 1.96? Population SD is unknown and is estimated from the sample. The t critical value accounts for this additional uncertainty; the appropriate method still depends on the design and distribution.
- Does the interval mean 95% of patients wait 35.87–44.13 minutes? No. It estimates the population mean, not the spread of individual waiting times.
- Will a larger sample remove selection bias? No. It may improve precision under the model while leaving a systematically biased estimate.
- What is the no-association value for a risk ratio? One. For a difference in means, it is zero. Interpret any interval against the correct parameter and clinical question.
Read the point estimate, interval, units, sampling method and assumptions together. A narrow interval is not proof of causal validity, and a wide interval may remain compatible with several clinically important possibilities.